Features — Explore and use the catalog
datannur brings together, in a single interface, the essential functions of a data catalog: browsing, documentation, metadata exploration, and use. The tool makes it possible to find datasets, understand their structure, explore their dependencies, and track how they evolve over time.
The goal is not only to store information, but to make data easier to read, more usable, and simpler to govern on a day-to-day basis.
Browsing
datannur lets you browse the catalog in several complementary ways. The tree view provides a structured view of organizations, folders, datasets, variables, and documents, while search and filters provide direct access to relevant information.
This multi-faceted navigation makes the catalog usable both for broad exploration and for targeted needs: finding a dataset, identifying a variable, locating an owner, or browsing a related set of documents.
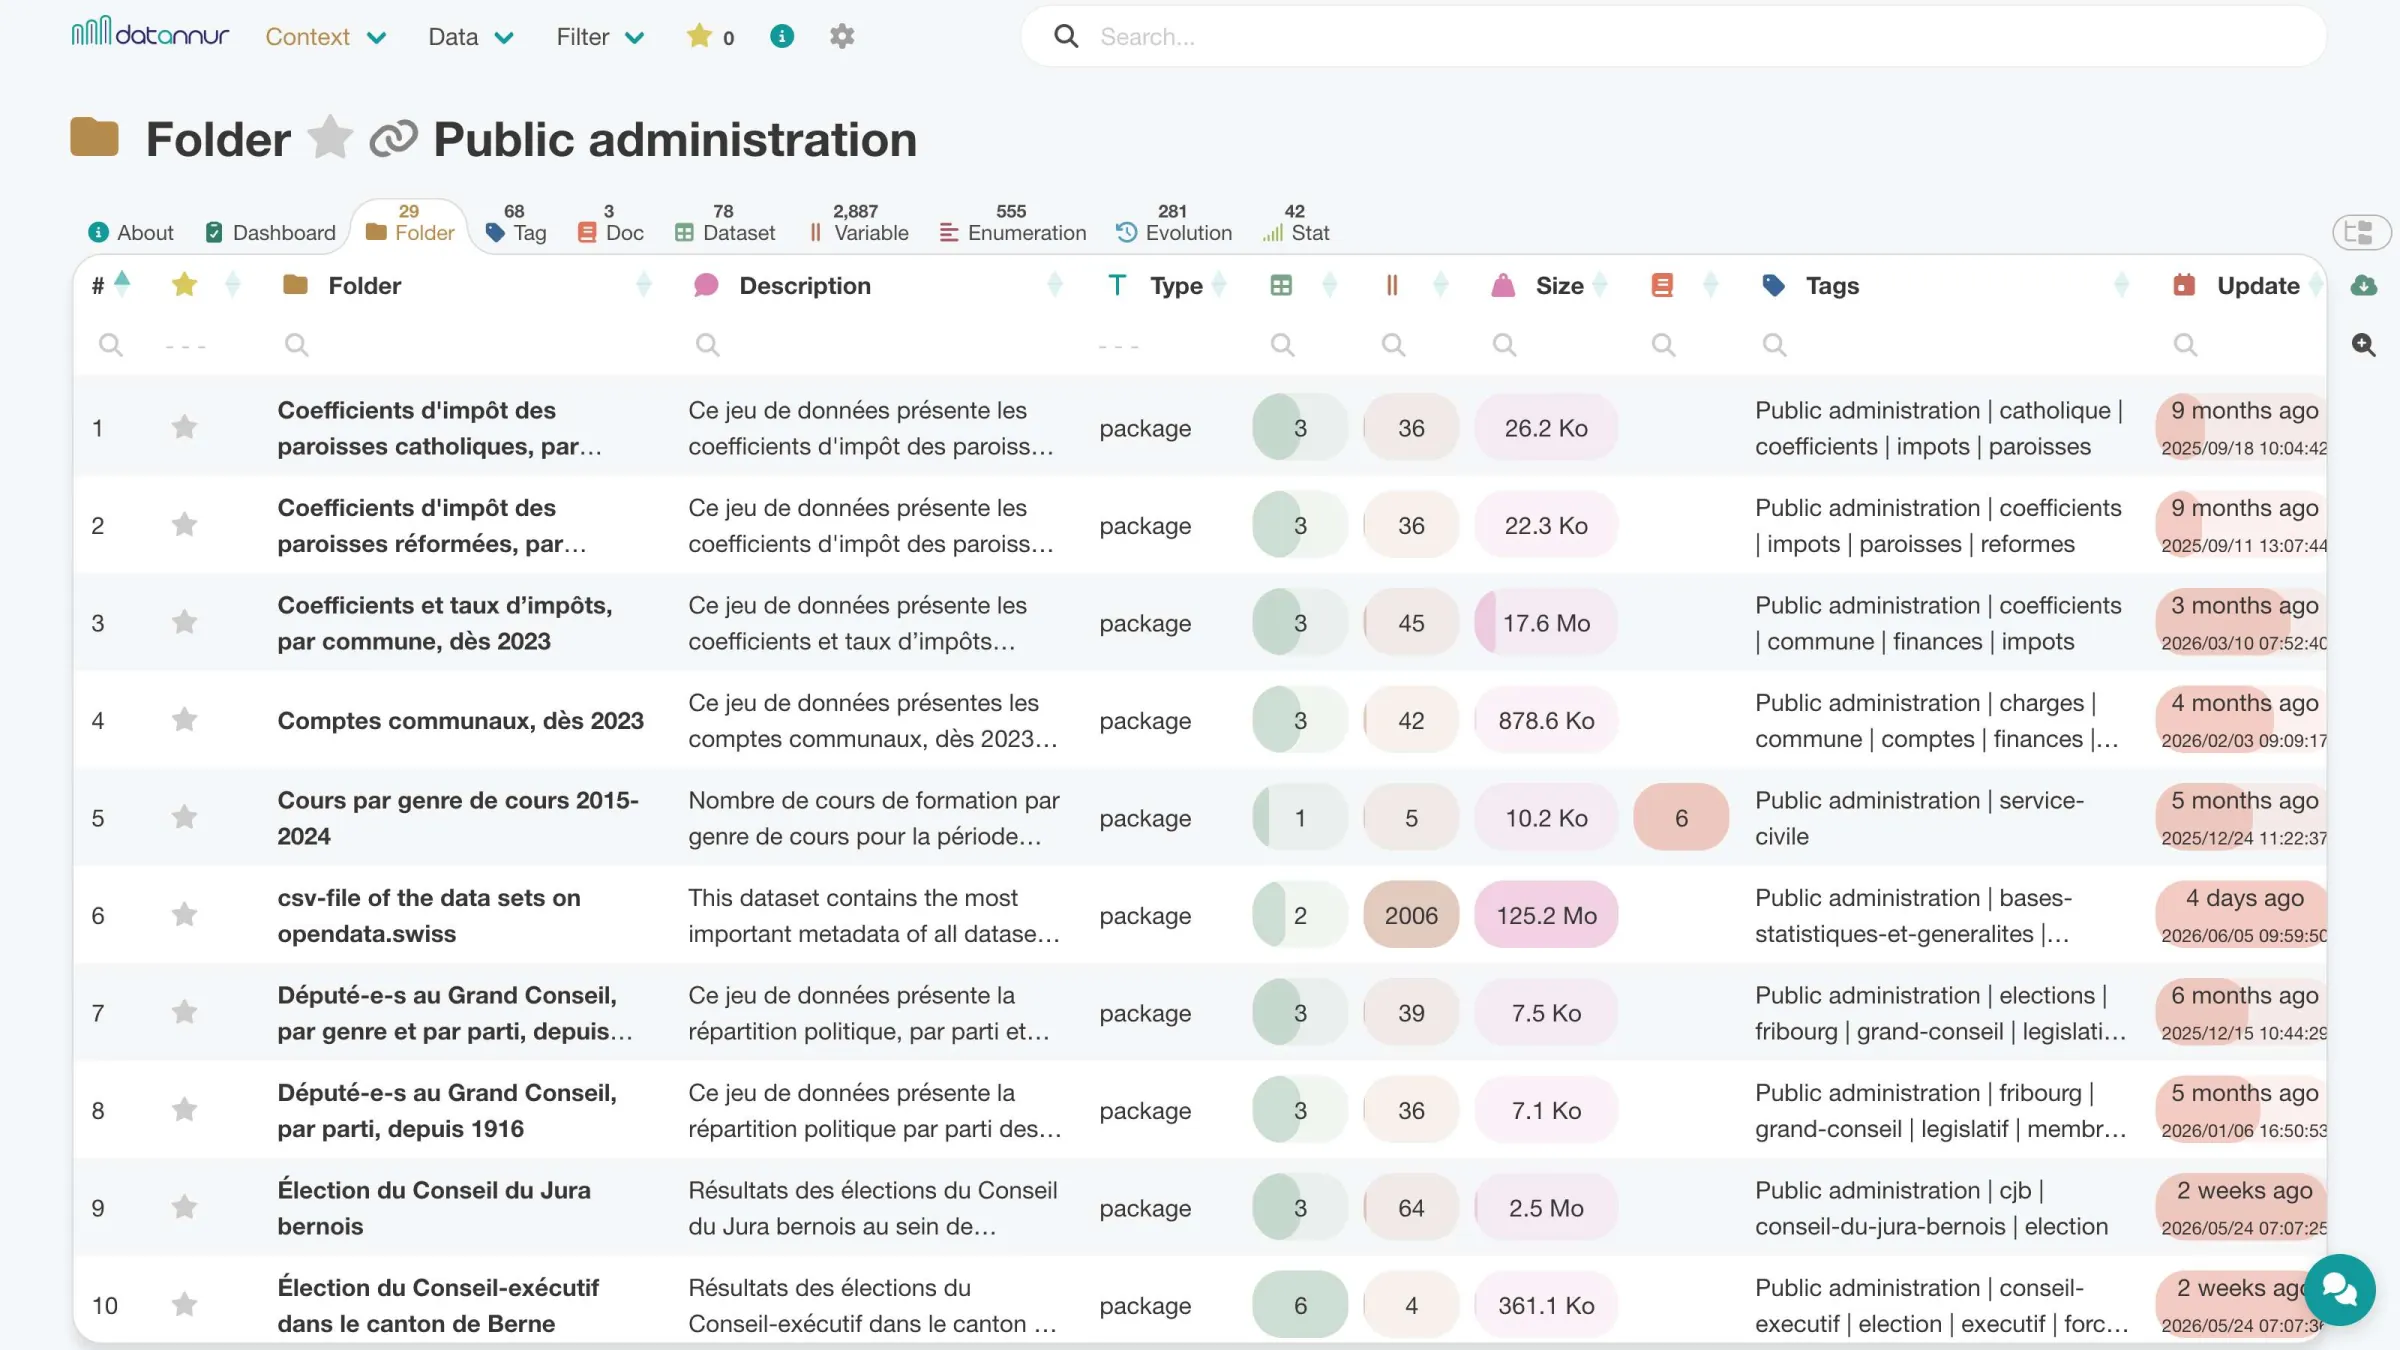
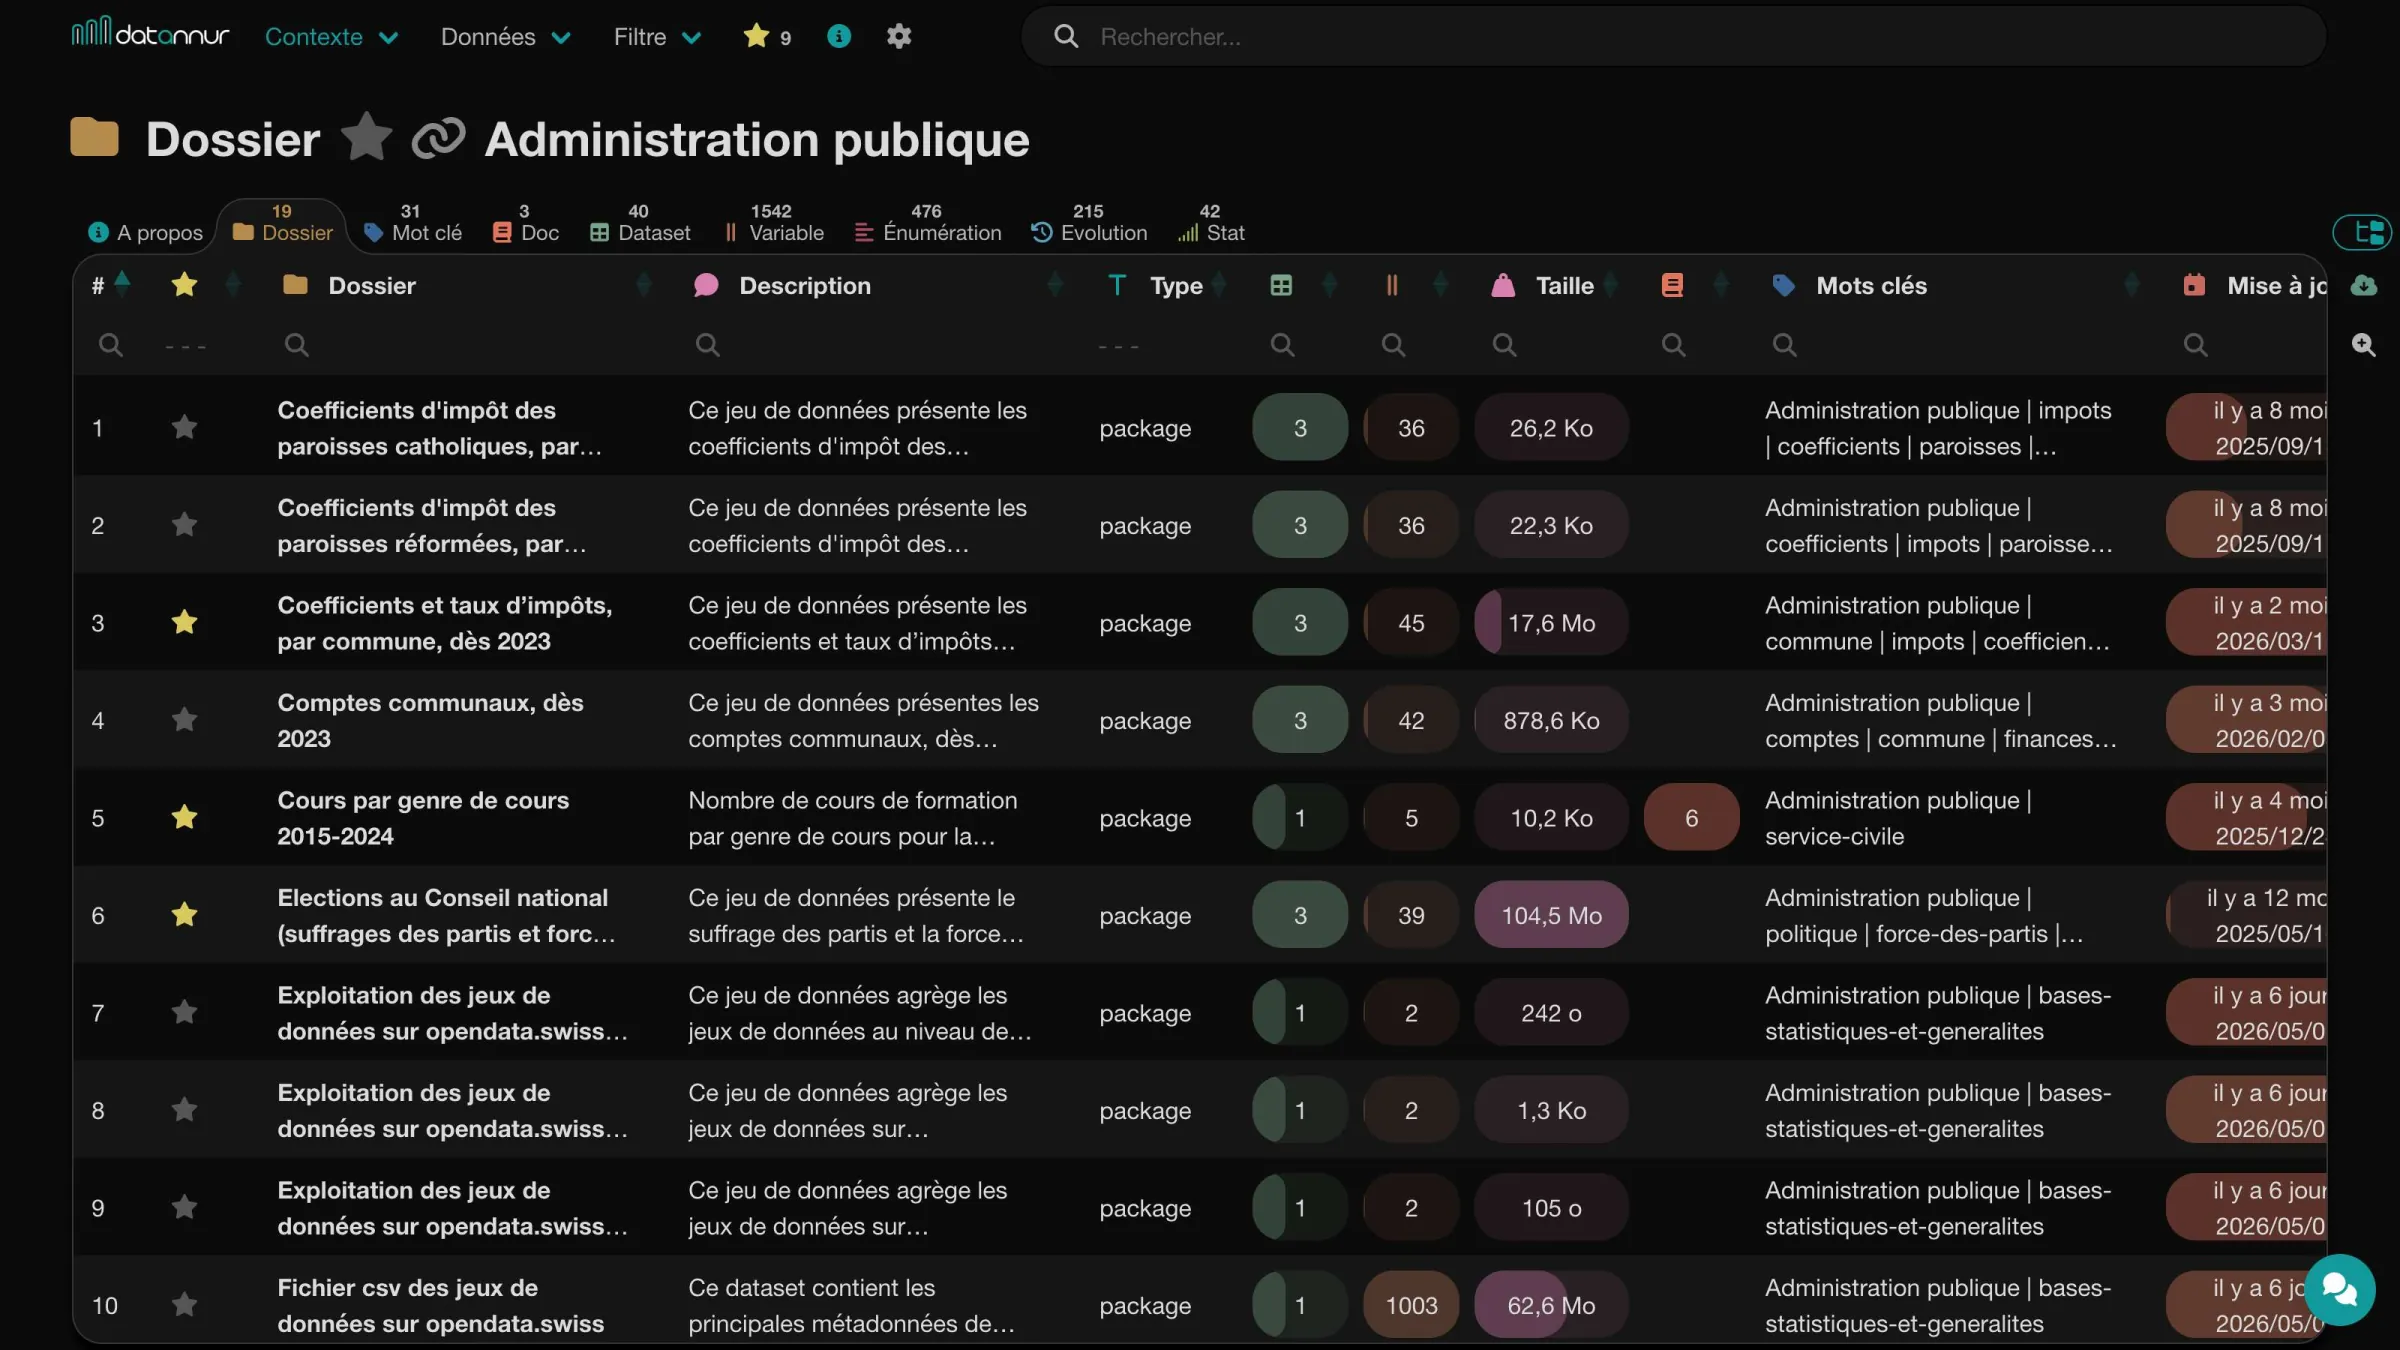 Public Admin folder – folder tab
Search
The search bar lets you quickly find the most relevant items based on the terms entered. A dedicated page displays results clearly, with direct access to recent searches.
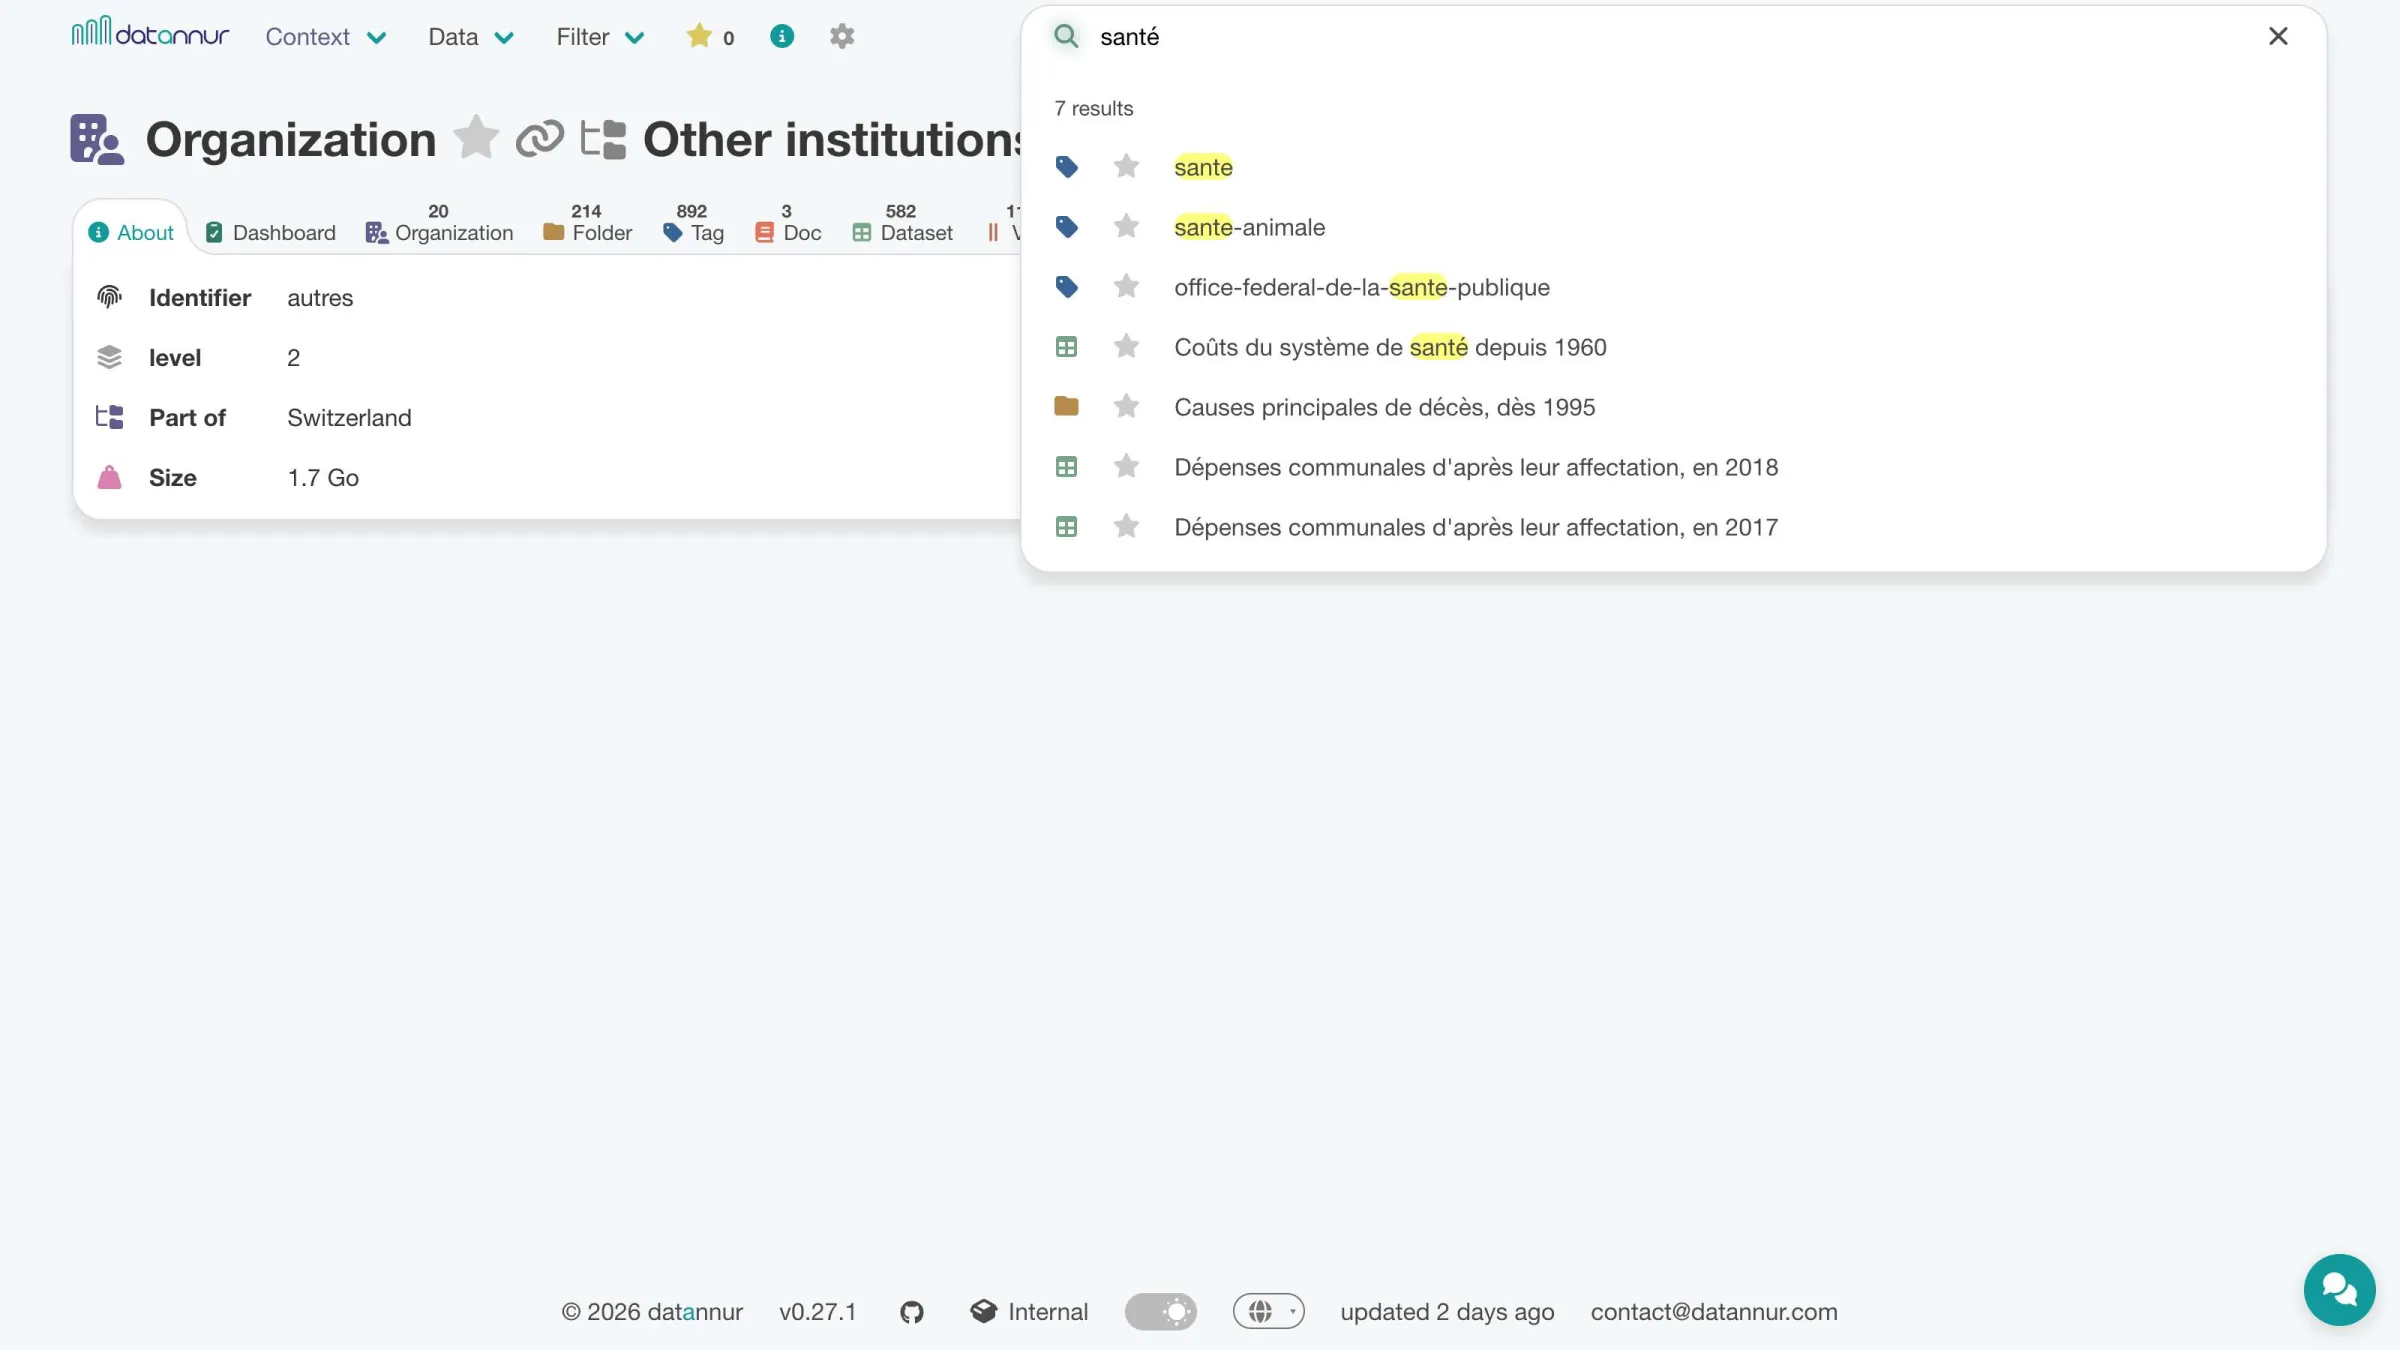
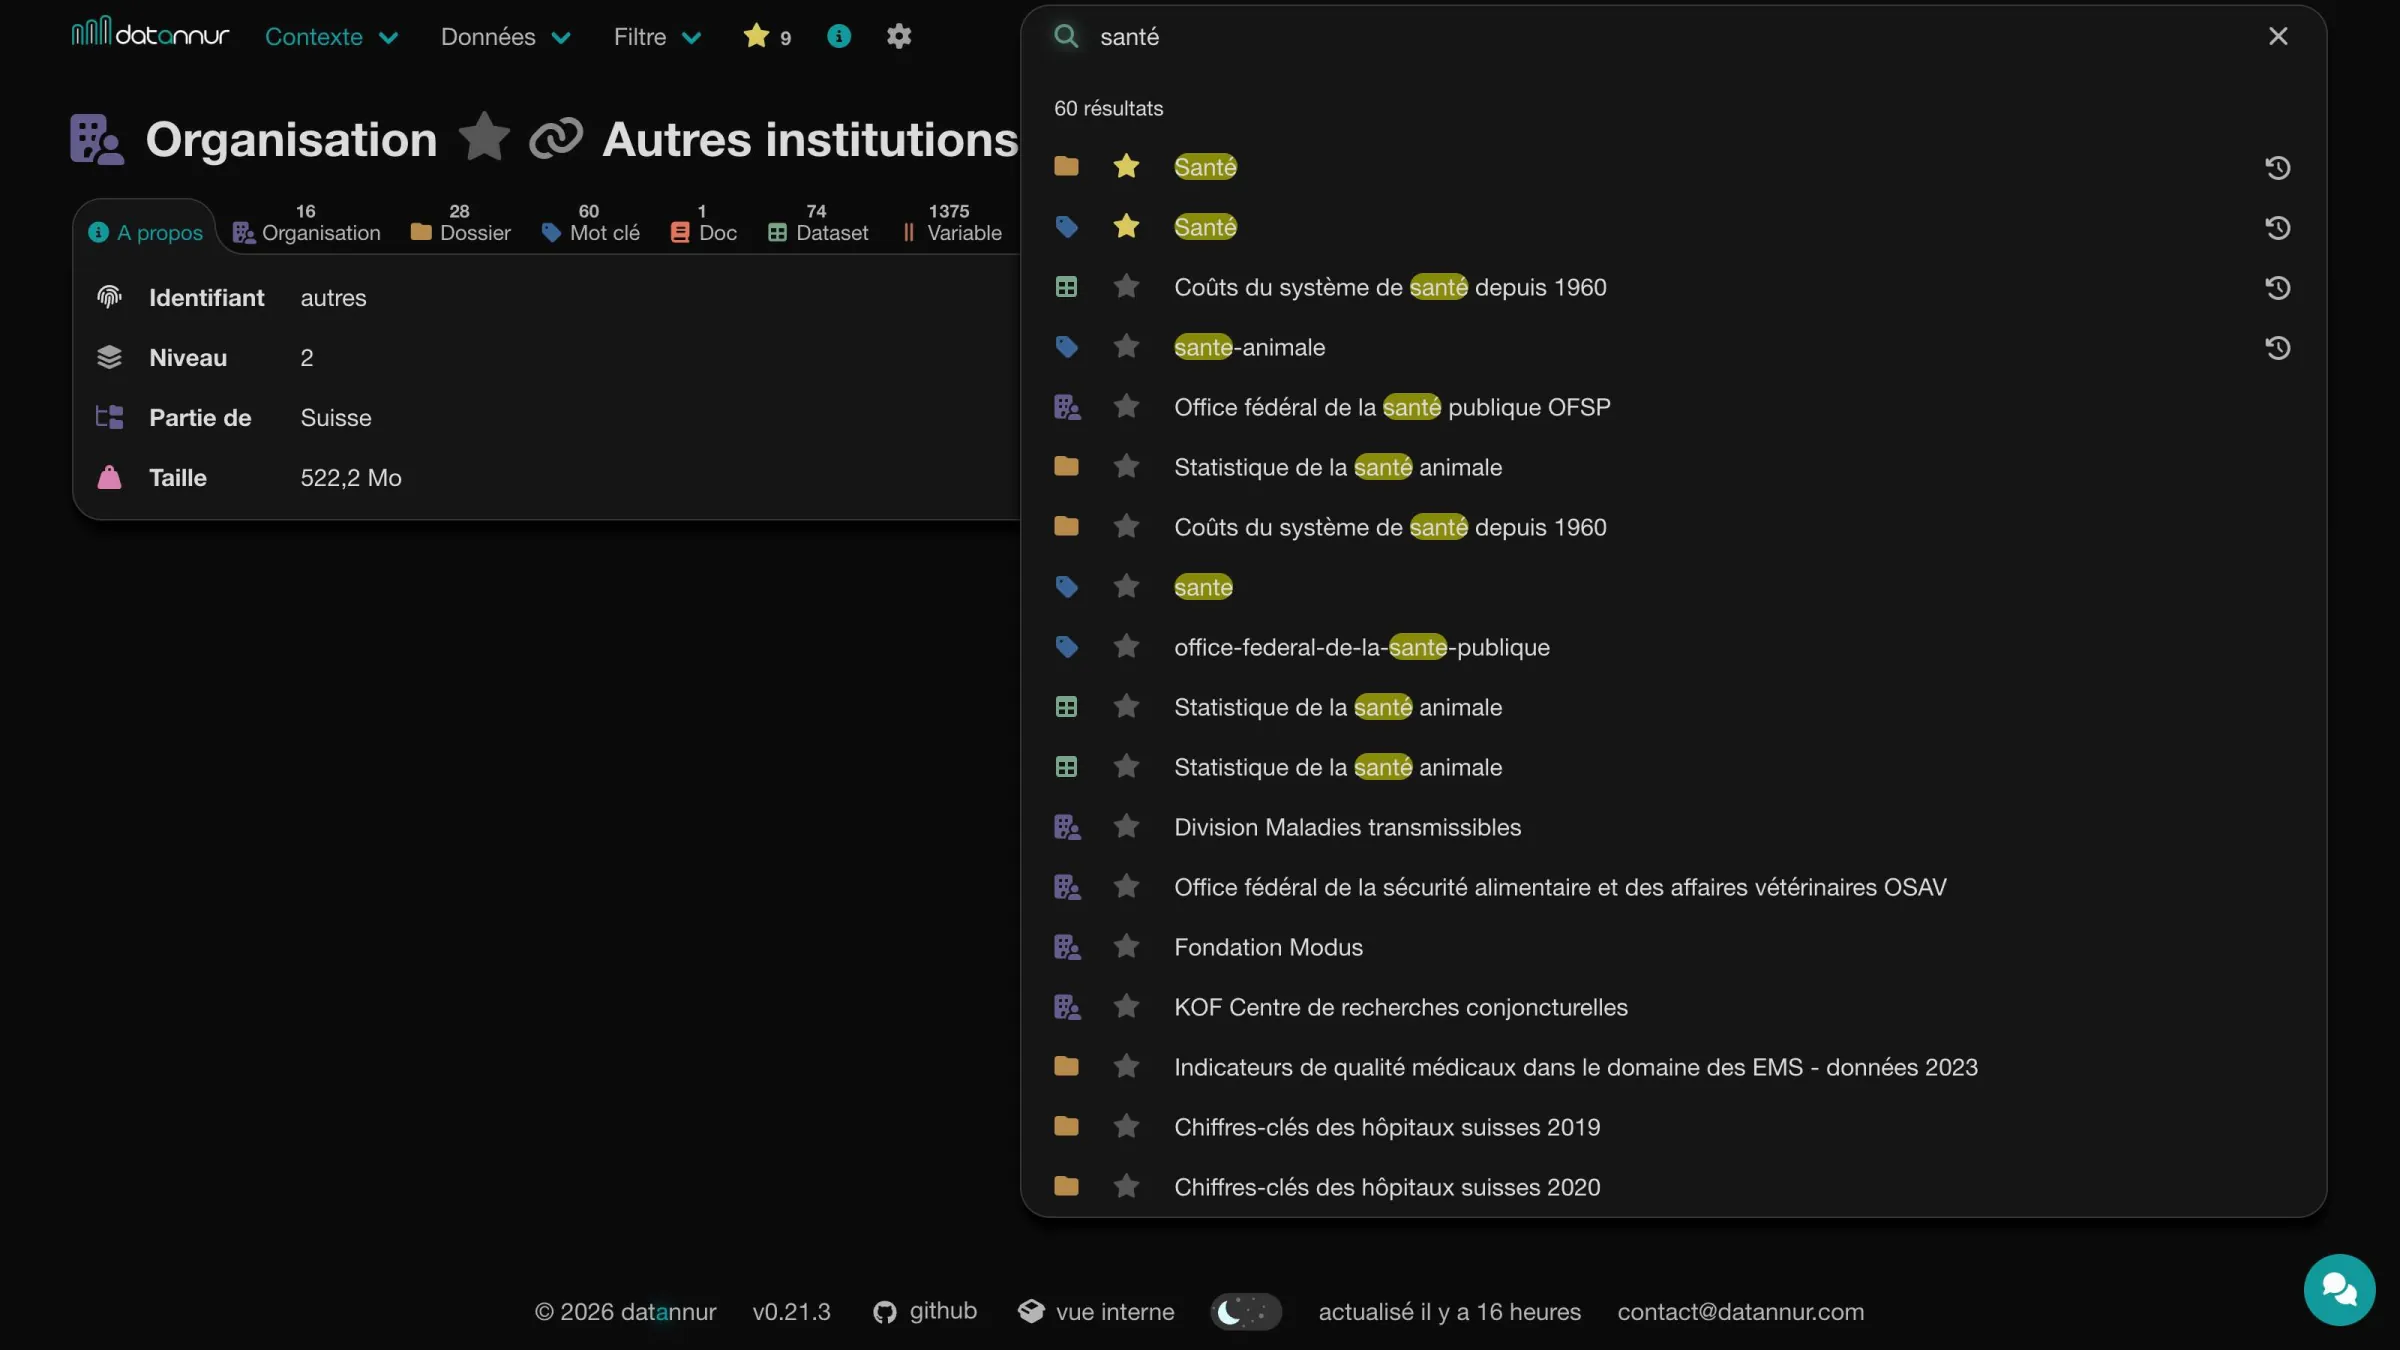 Organization page – active search bar
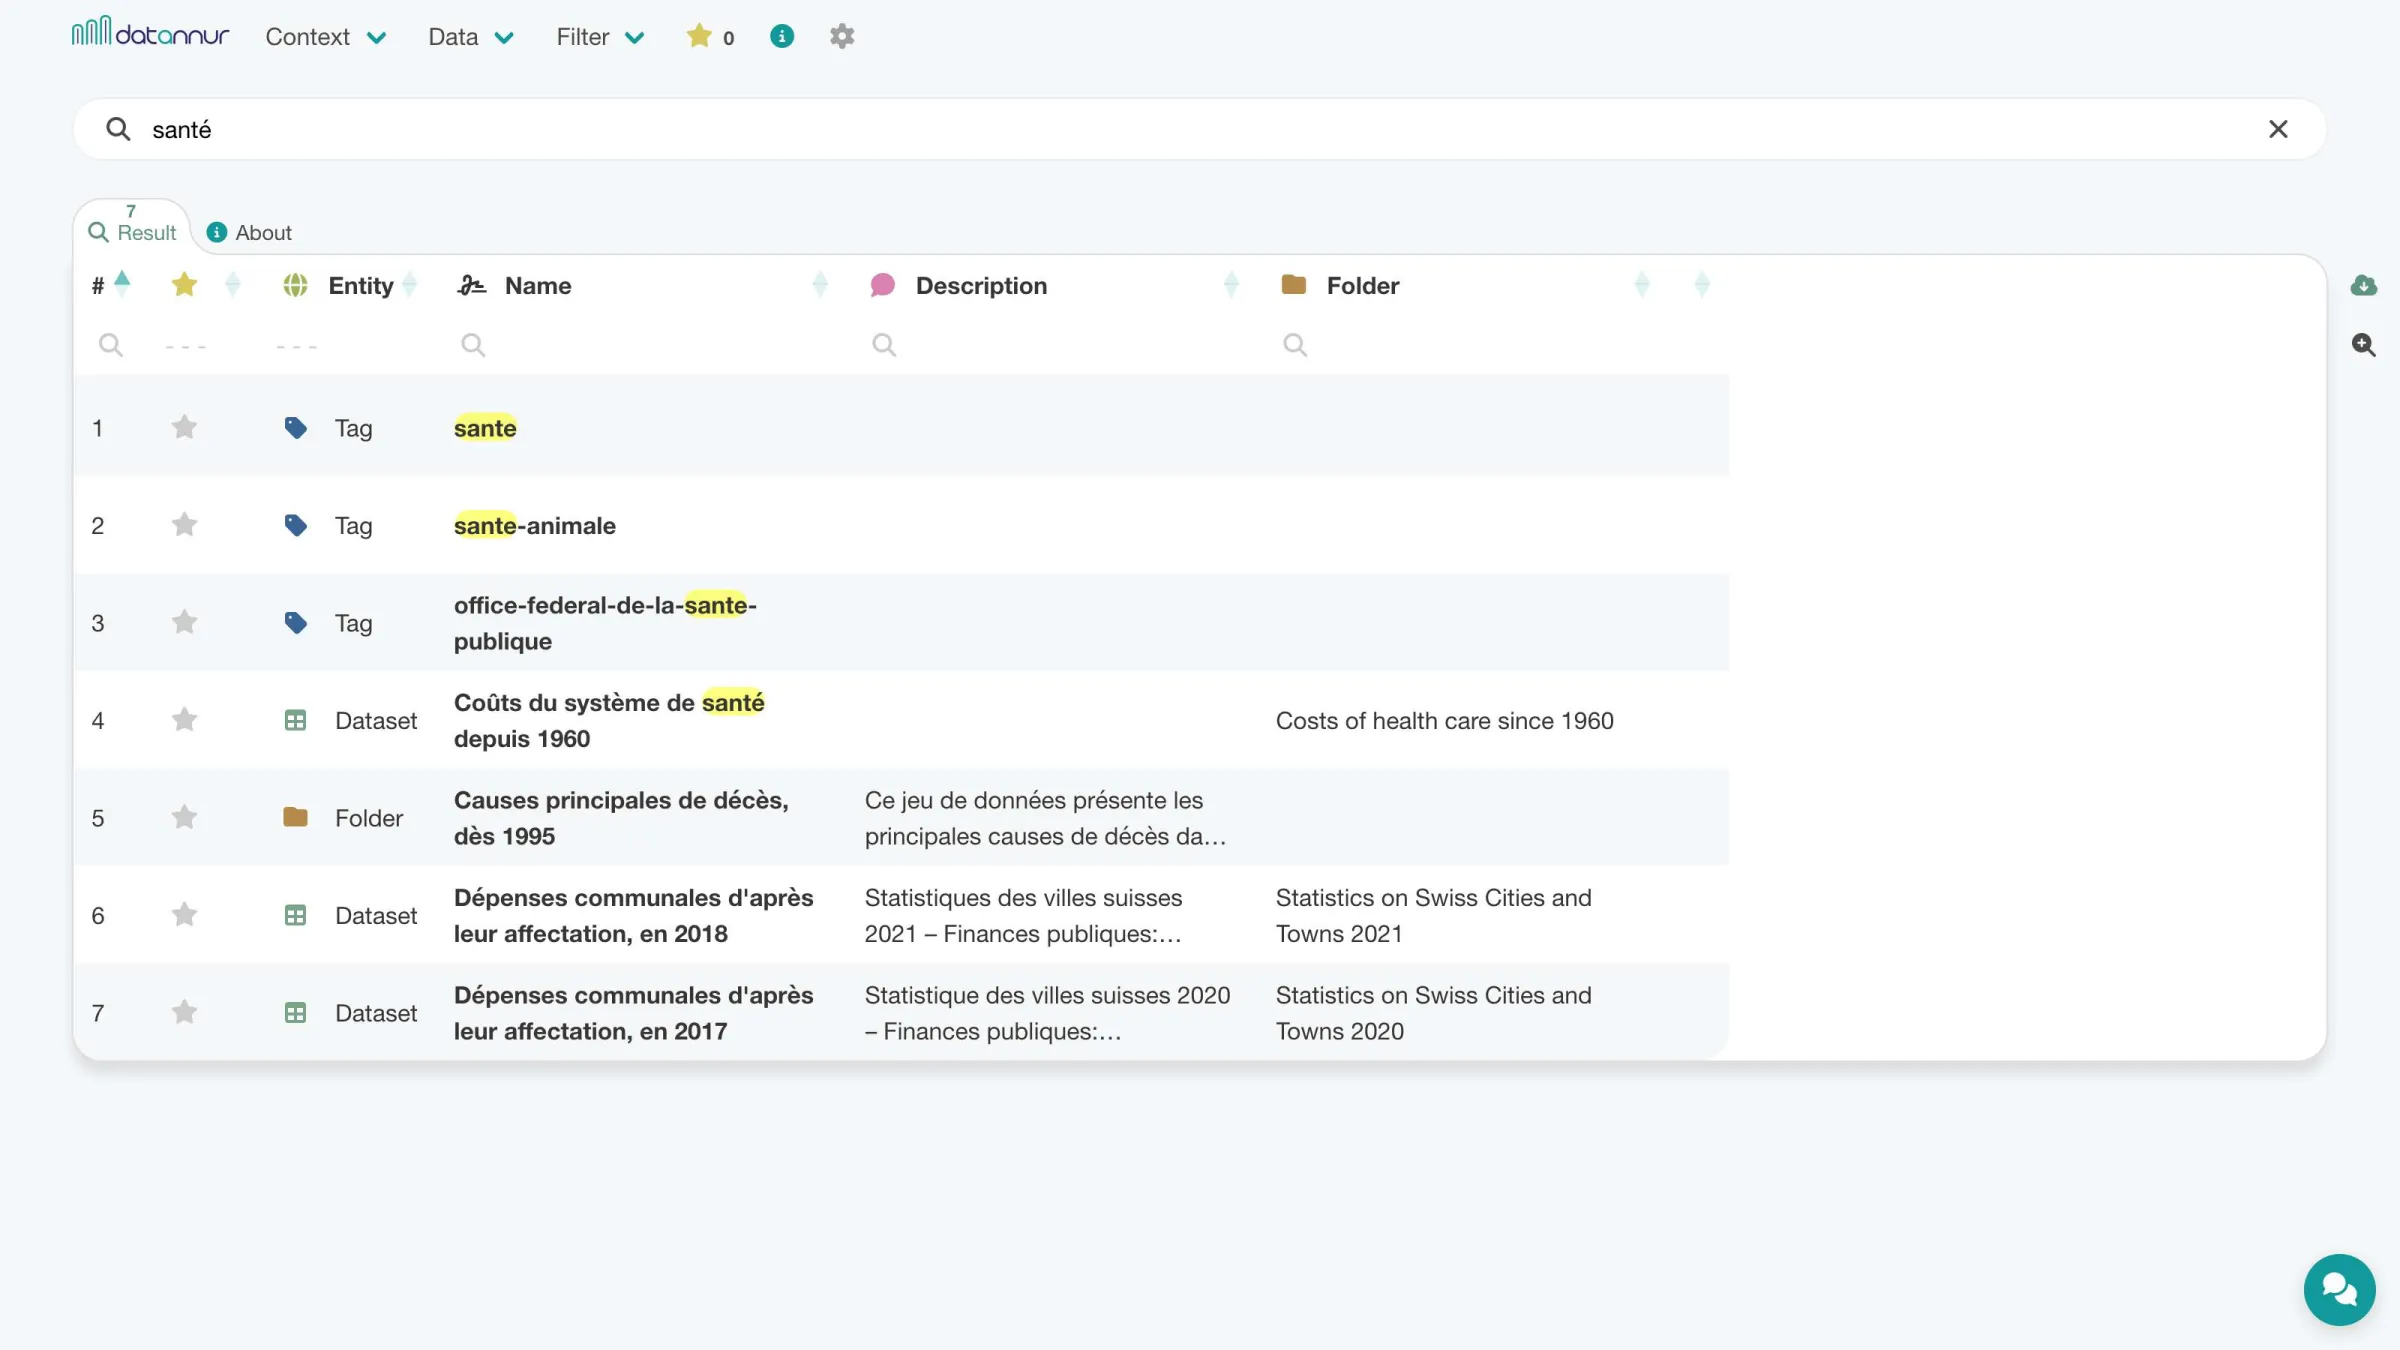
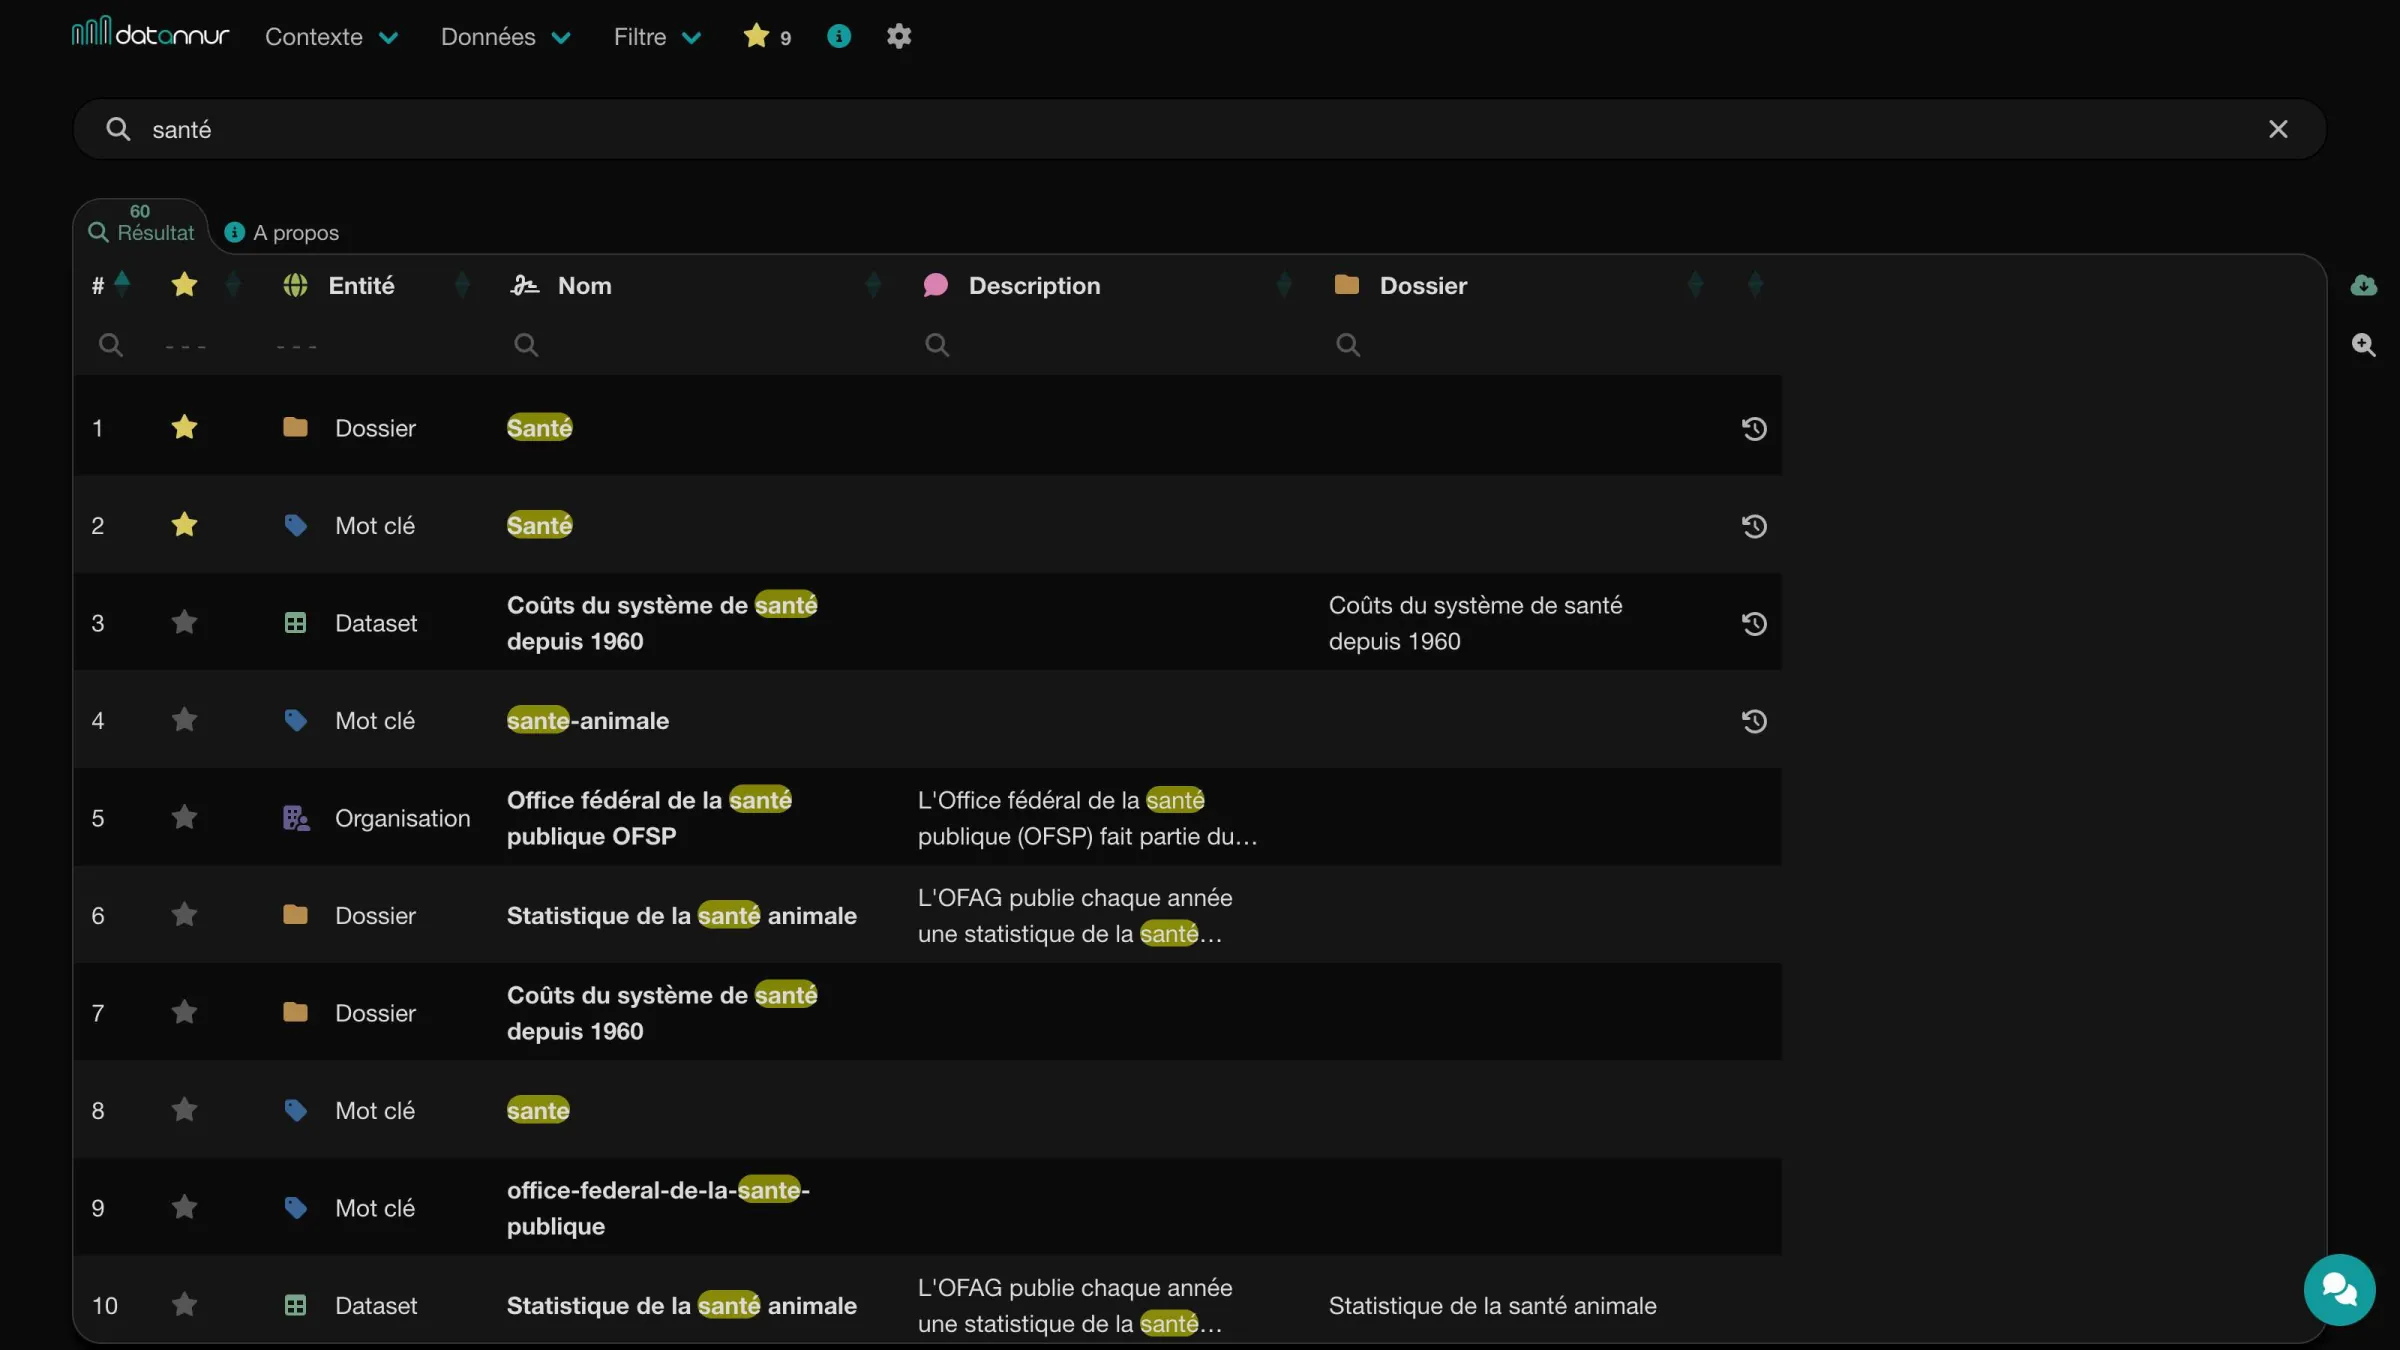 Search page
Filter
Each table provides per-column filters to refine results more precisely than global search. Multiple filters can be combined to isolate a relevant subset in just a few steps. Filters support different types of conditions depending on the nature of the columns.
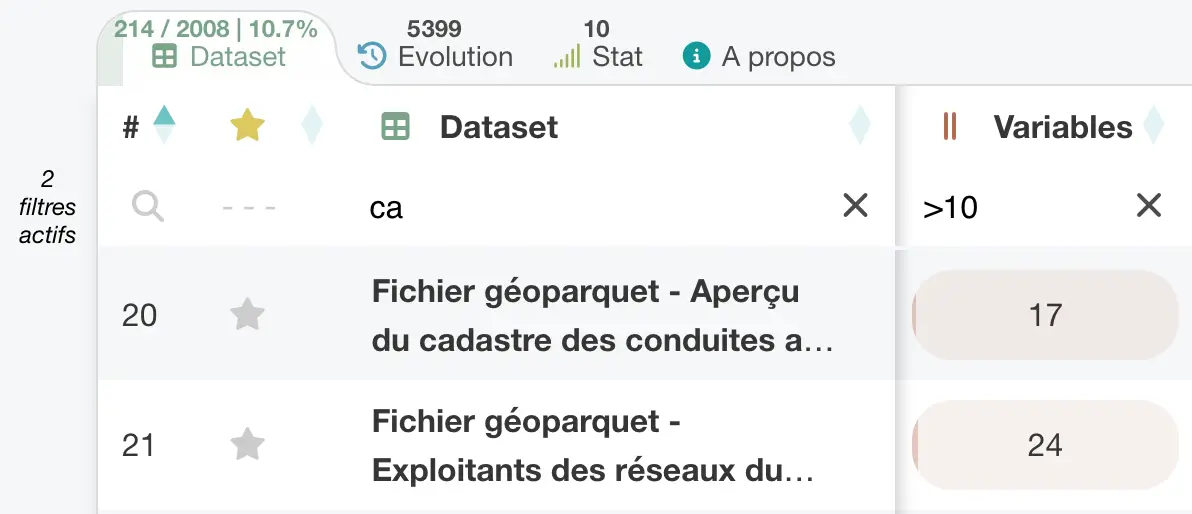
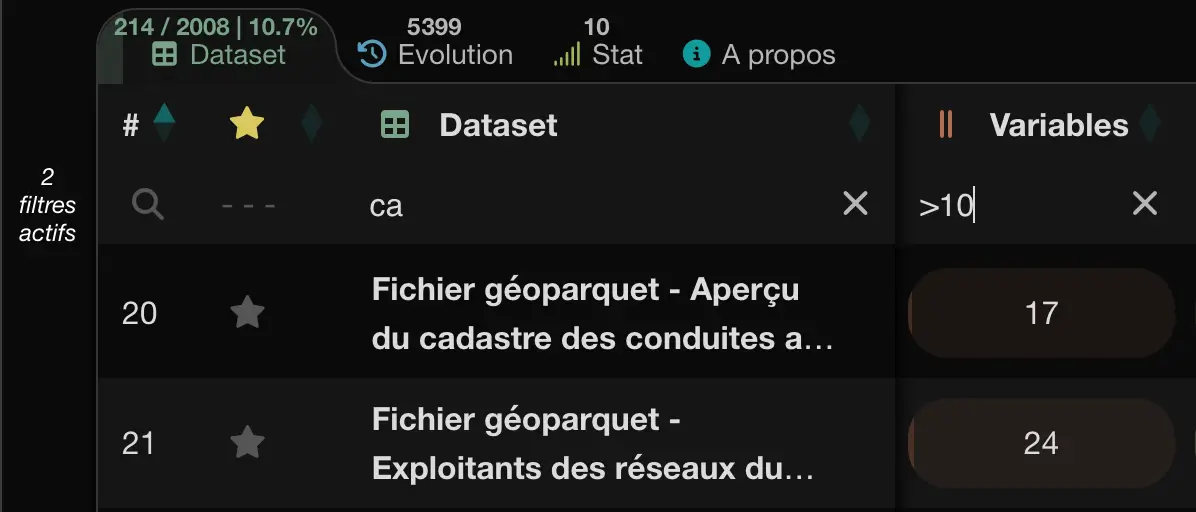 Datasets tab with two active filters
A global filter also makes it possible to include or exclude certain categories of datasets across the catalog, for example based on their openness status or processing level.
Sort
Tables can be sorted in ascending or descending order from each column. This sorting naturally combines with filters to make data exploration and analysis easier.
Tree view
datannur relies on a tree structure to organize organizations, folders, and keywords. Each item can contain sub-items across multiple levels, making it possible to accurately represent complex organizations.
Each node in the tree has its own page and acts as a subset of the catalog. You can therefore explore its content, its context, and the datasets attached to it. Combined with sorting and filters, this structure provides navigation that is both simple and powerful.
 About page – Organization: overview
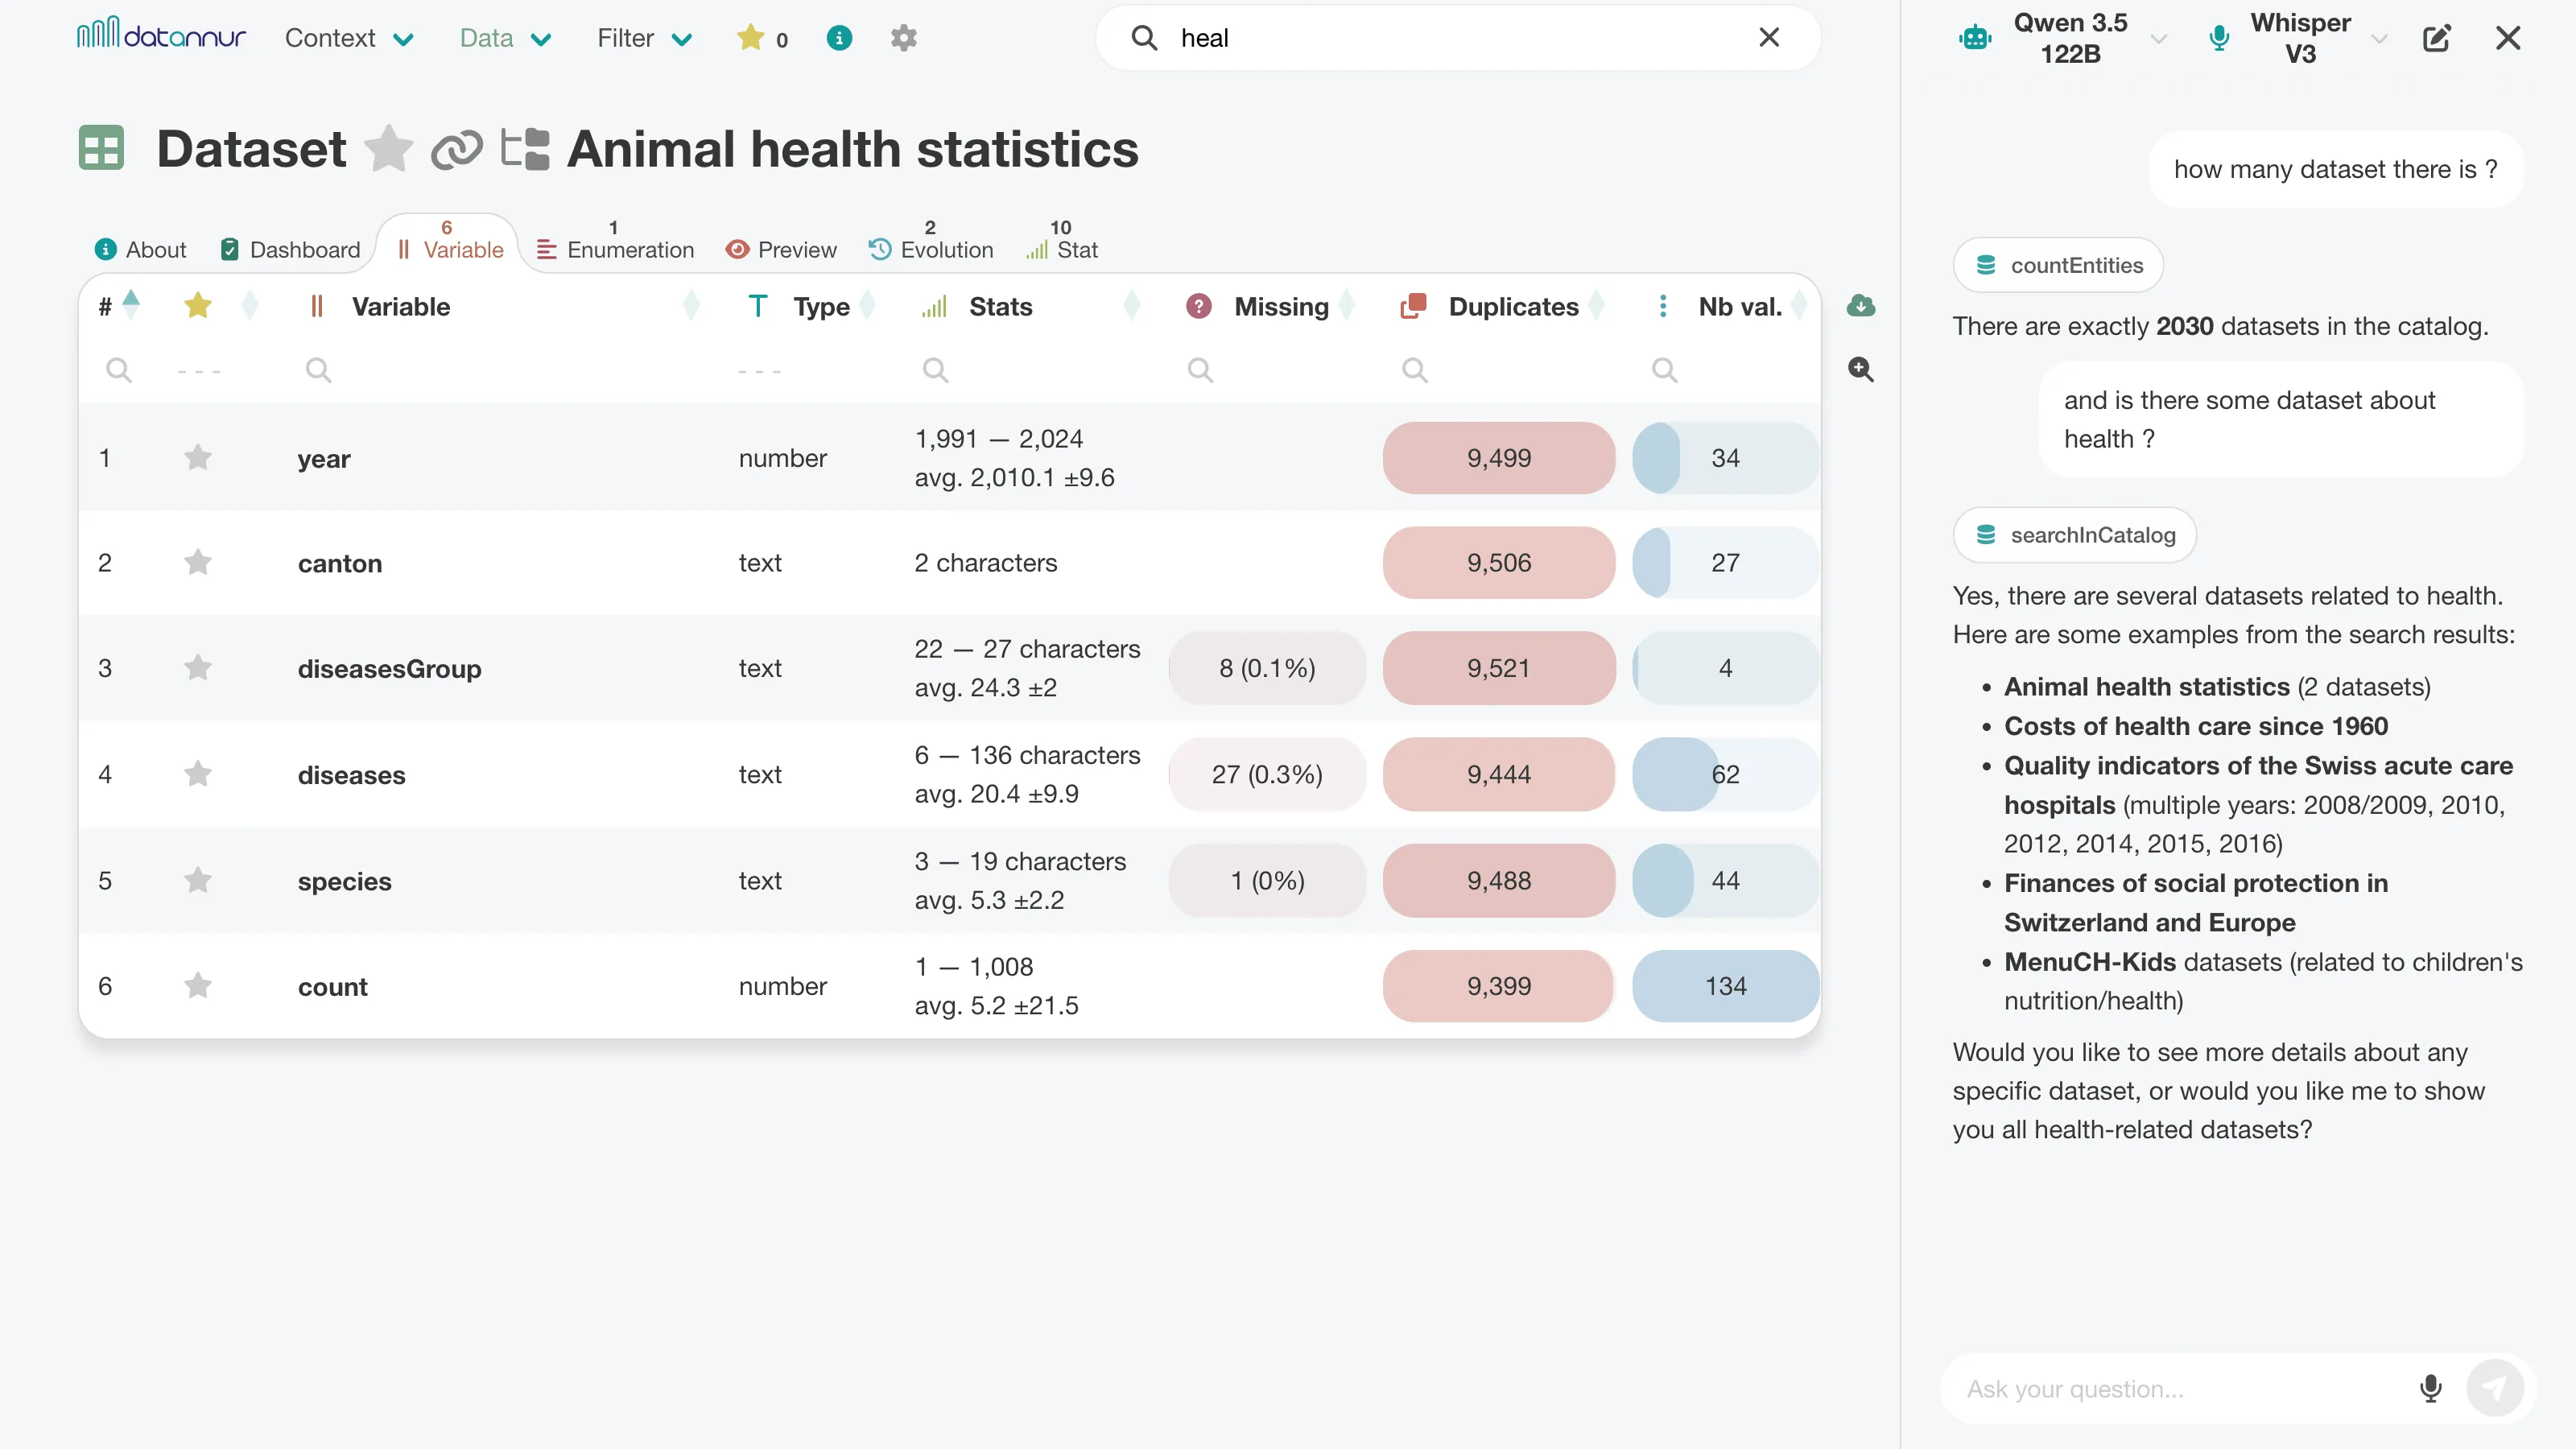
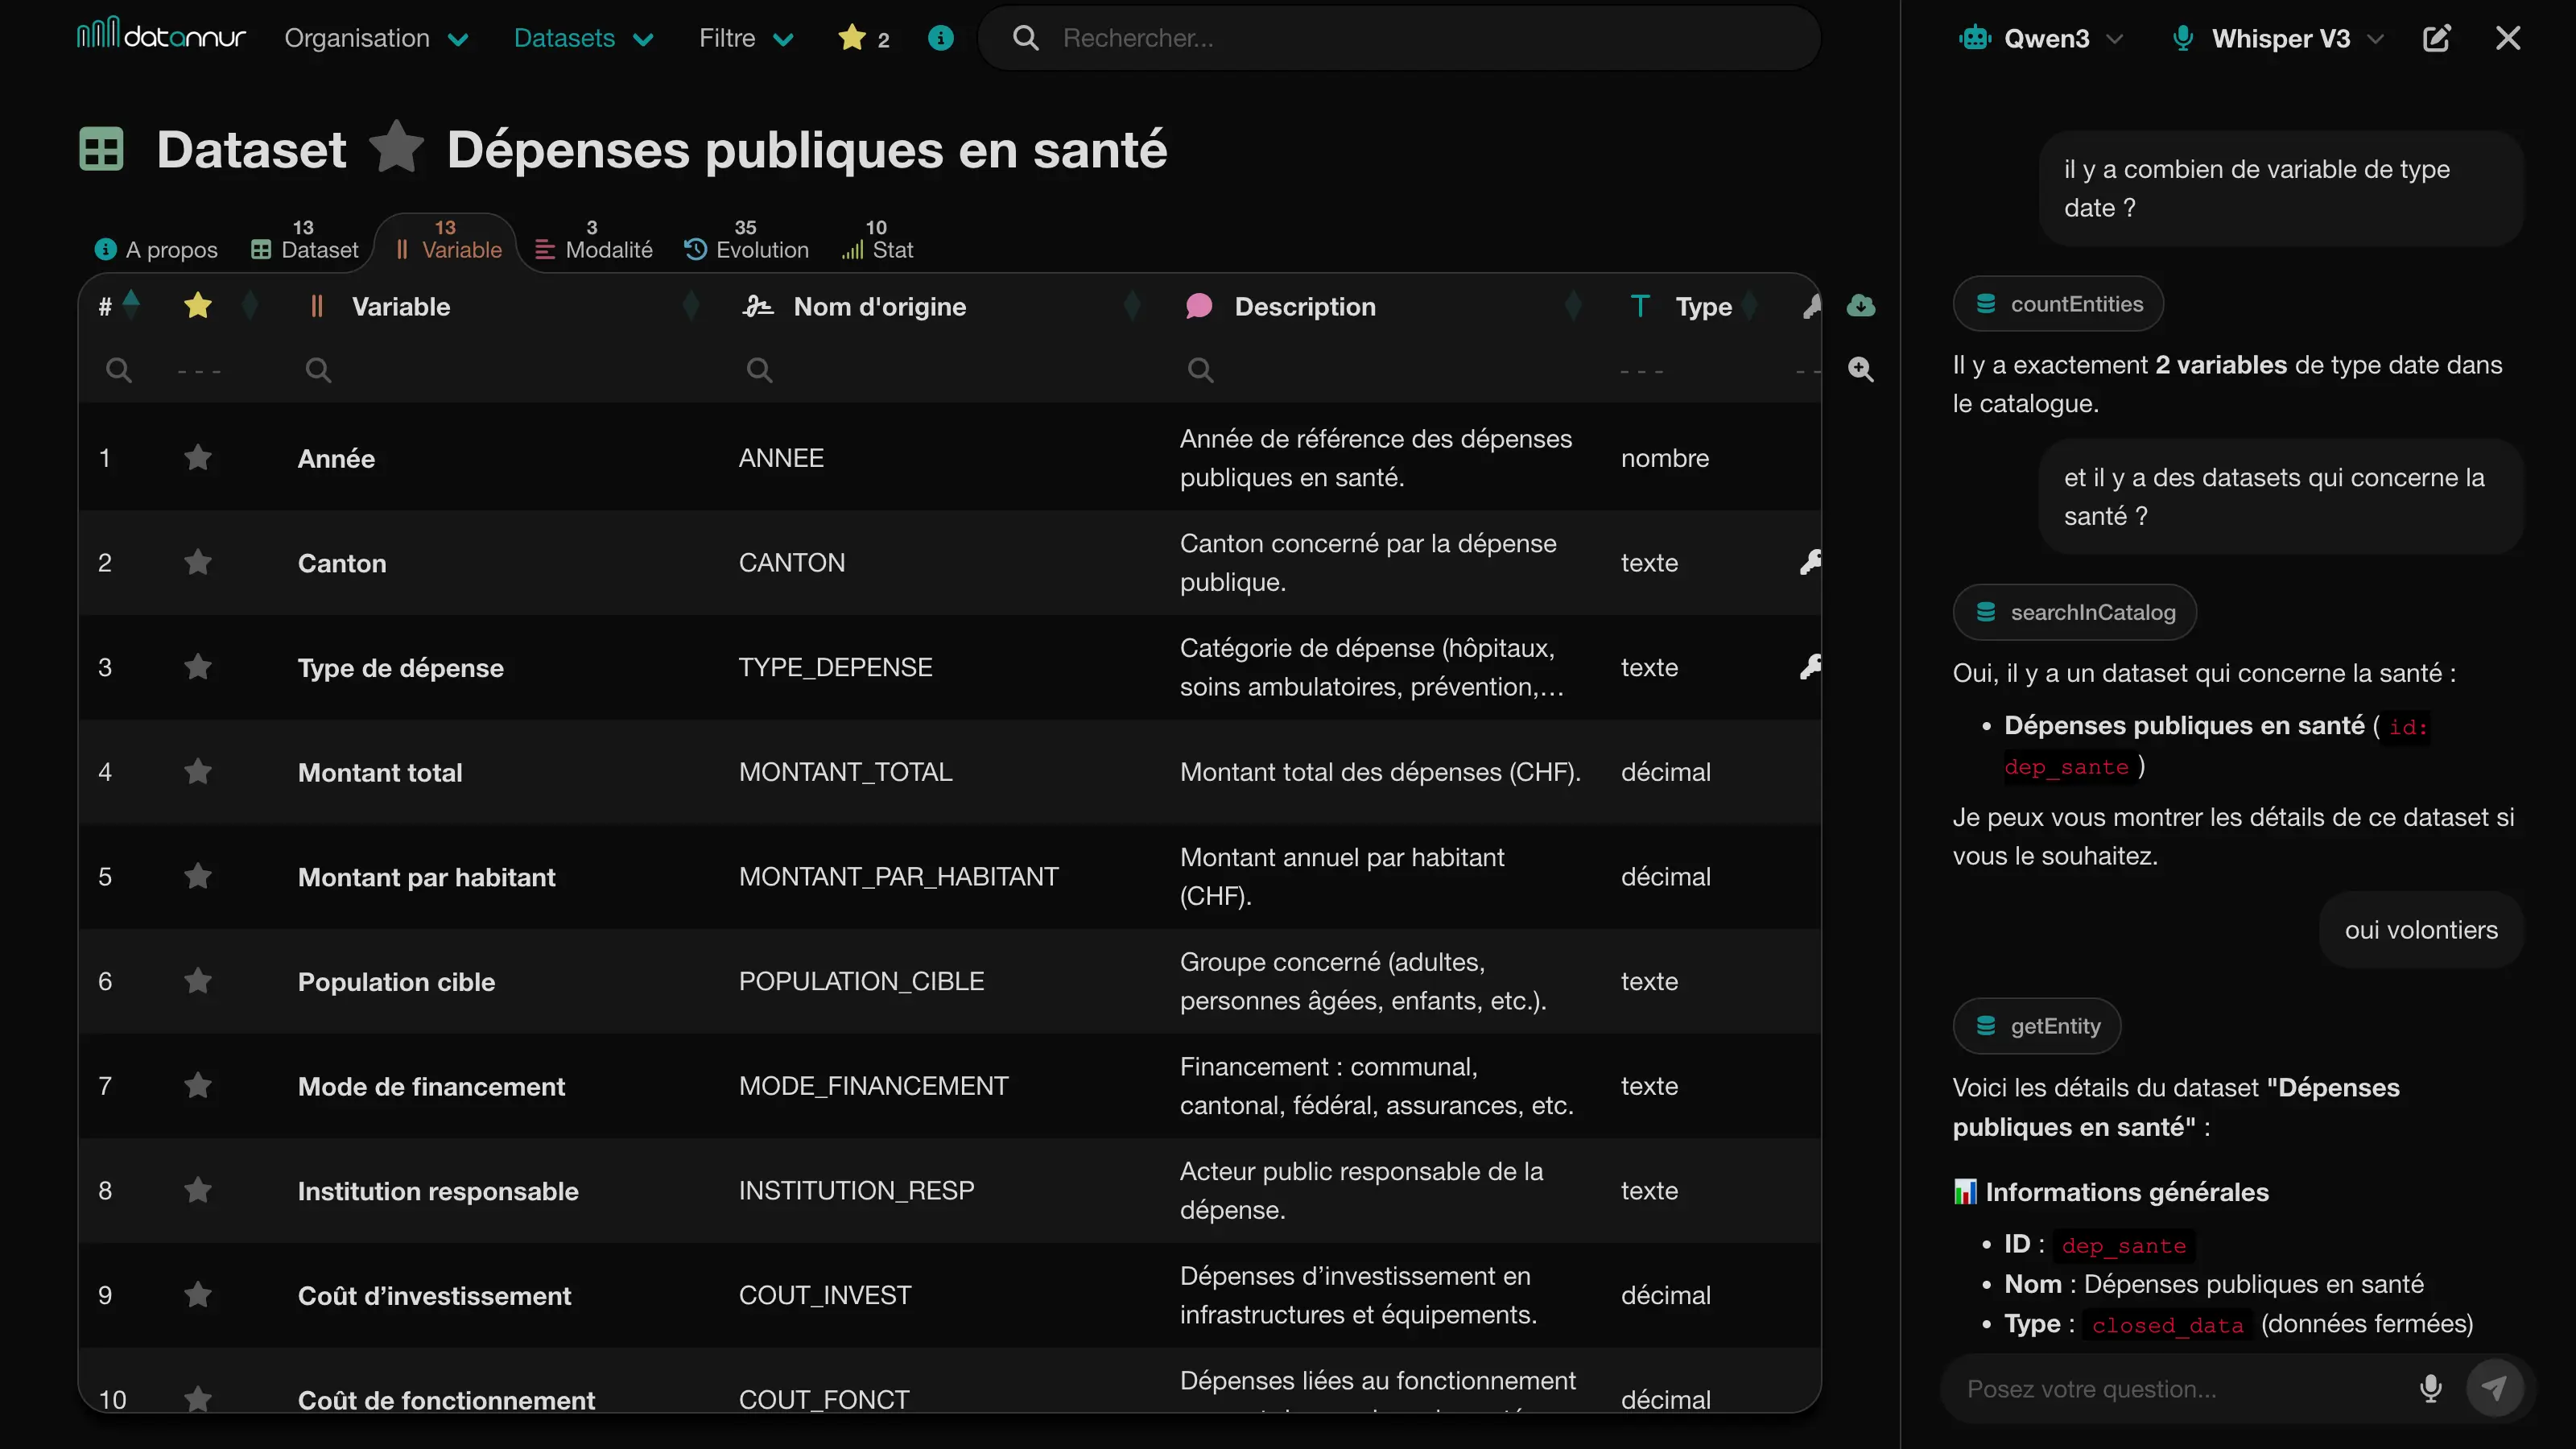
AI assistant
A chat sidebar allows you to explore the catalog in natural language. The assistant can answer questions about metadata, find relevant items, and navigate the catalog by relying directly on the available information.
Integrated into the interface, it complements traditional search, filtering, and exploration features by providing more direct and flexible access to the catalog’s content.
Information
Each page dedicated to a catalog item includes an “About” tab that brings together its main metadata. You will find its specific attributes—such as a description, an update date, or a contact—as well as the items it is linked to, such as its keywords, its folder, or related organizations.
The other tabs provide access to the items it contains or is associated with, such as datasets, variables, enumerations, or documents.
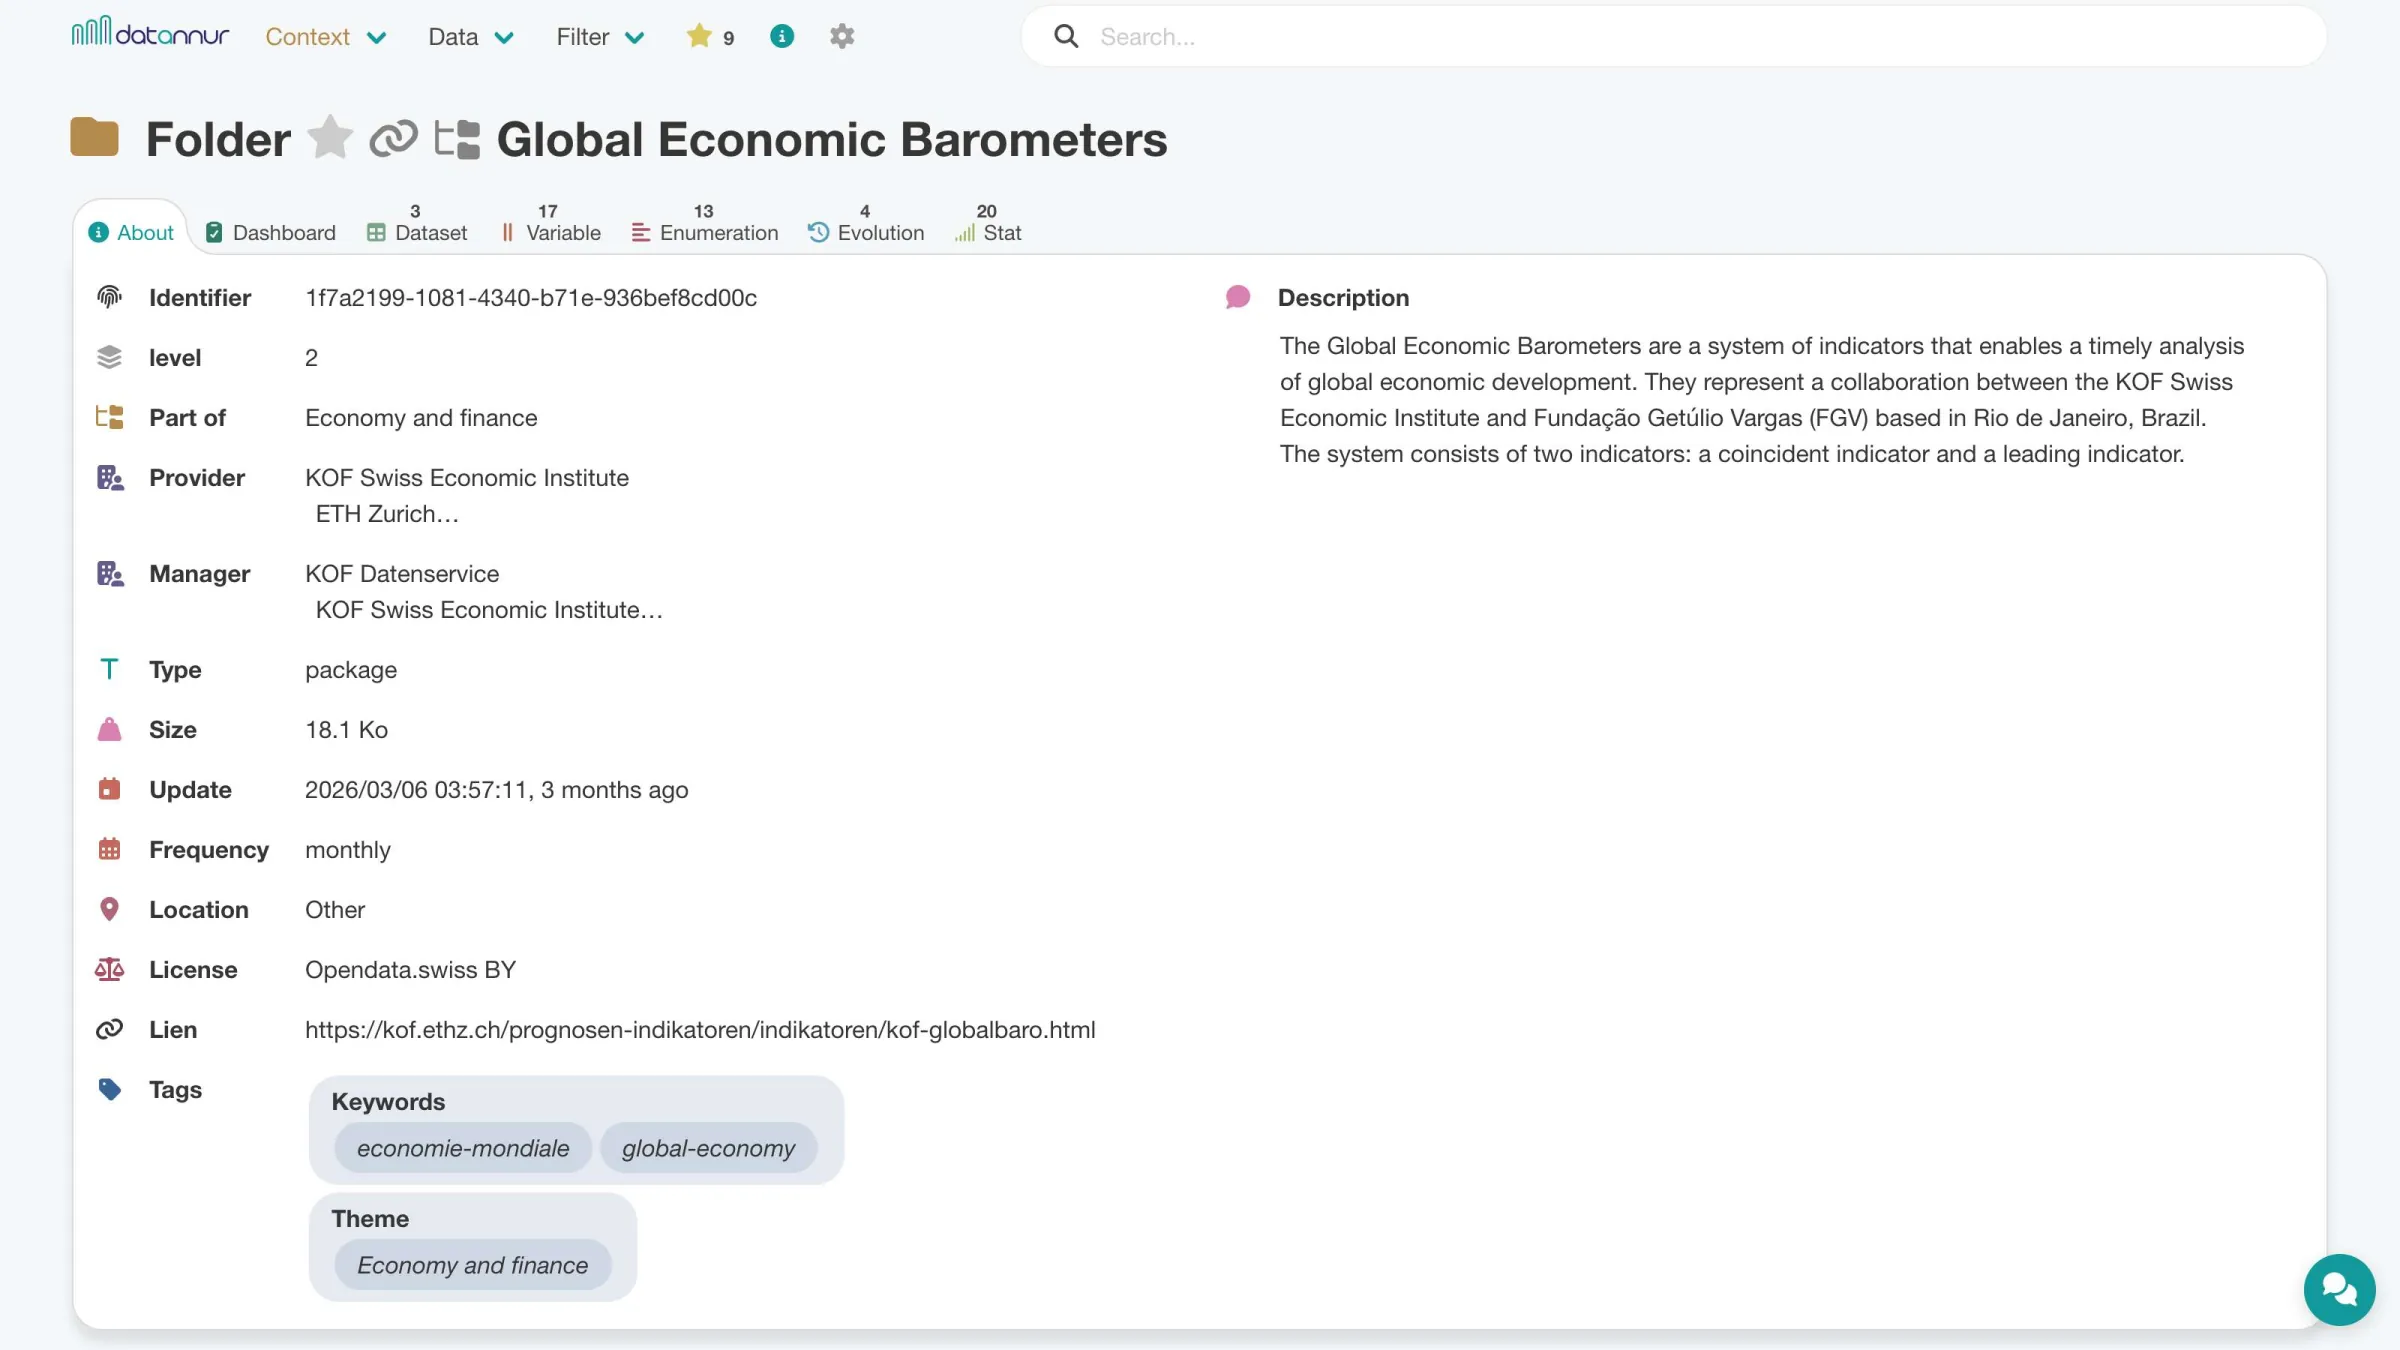
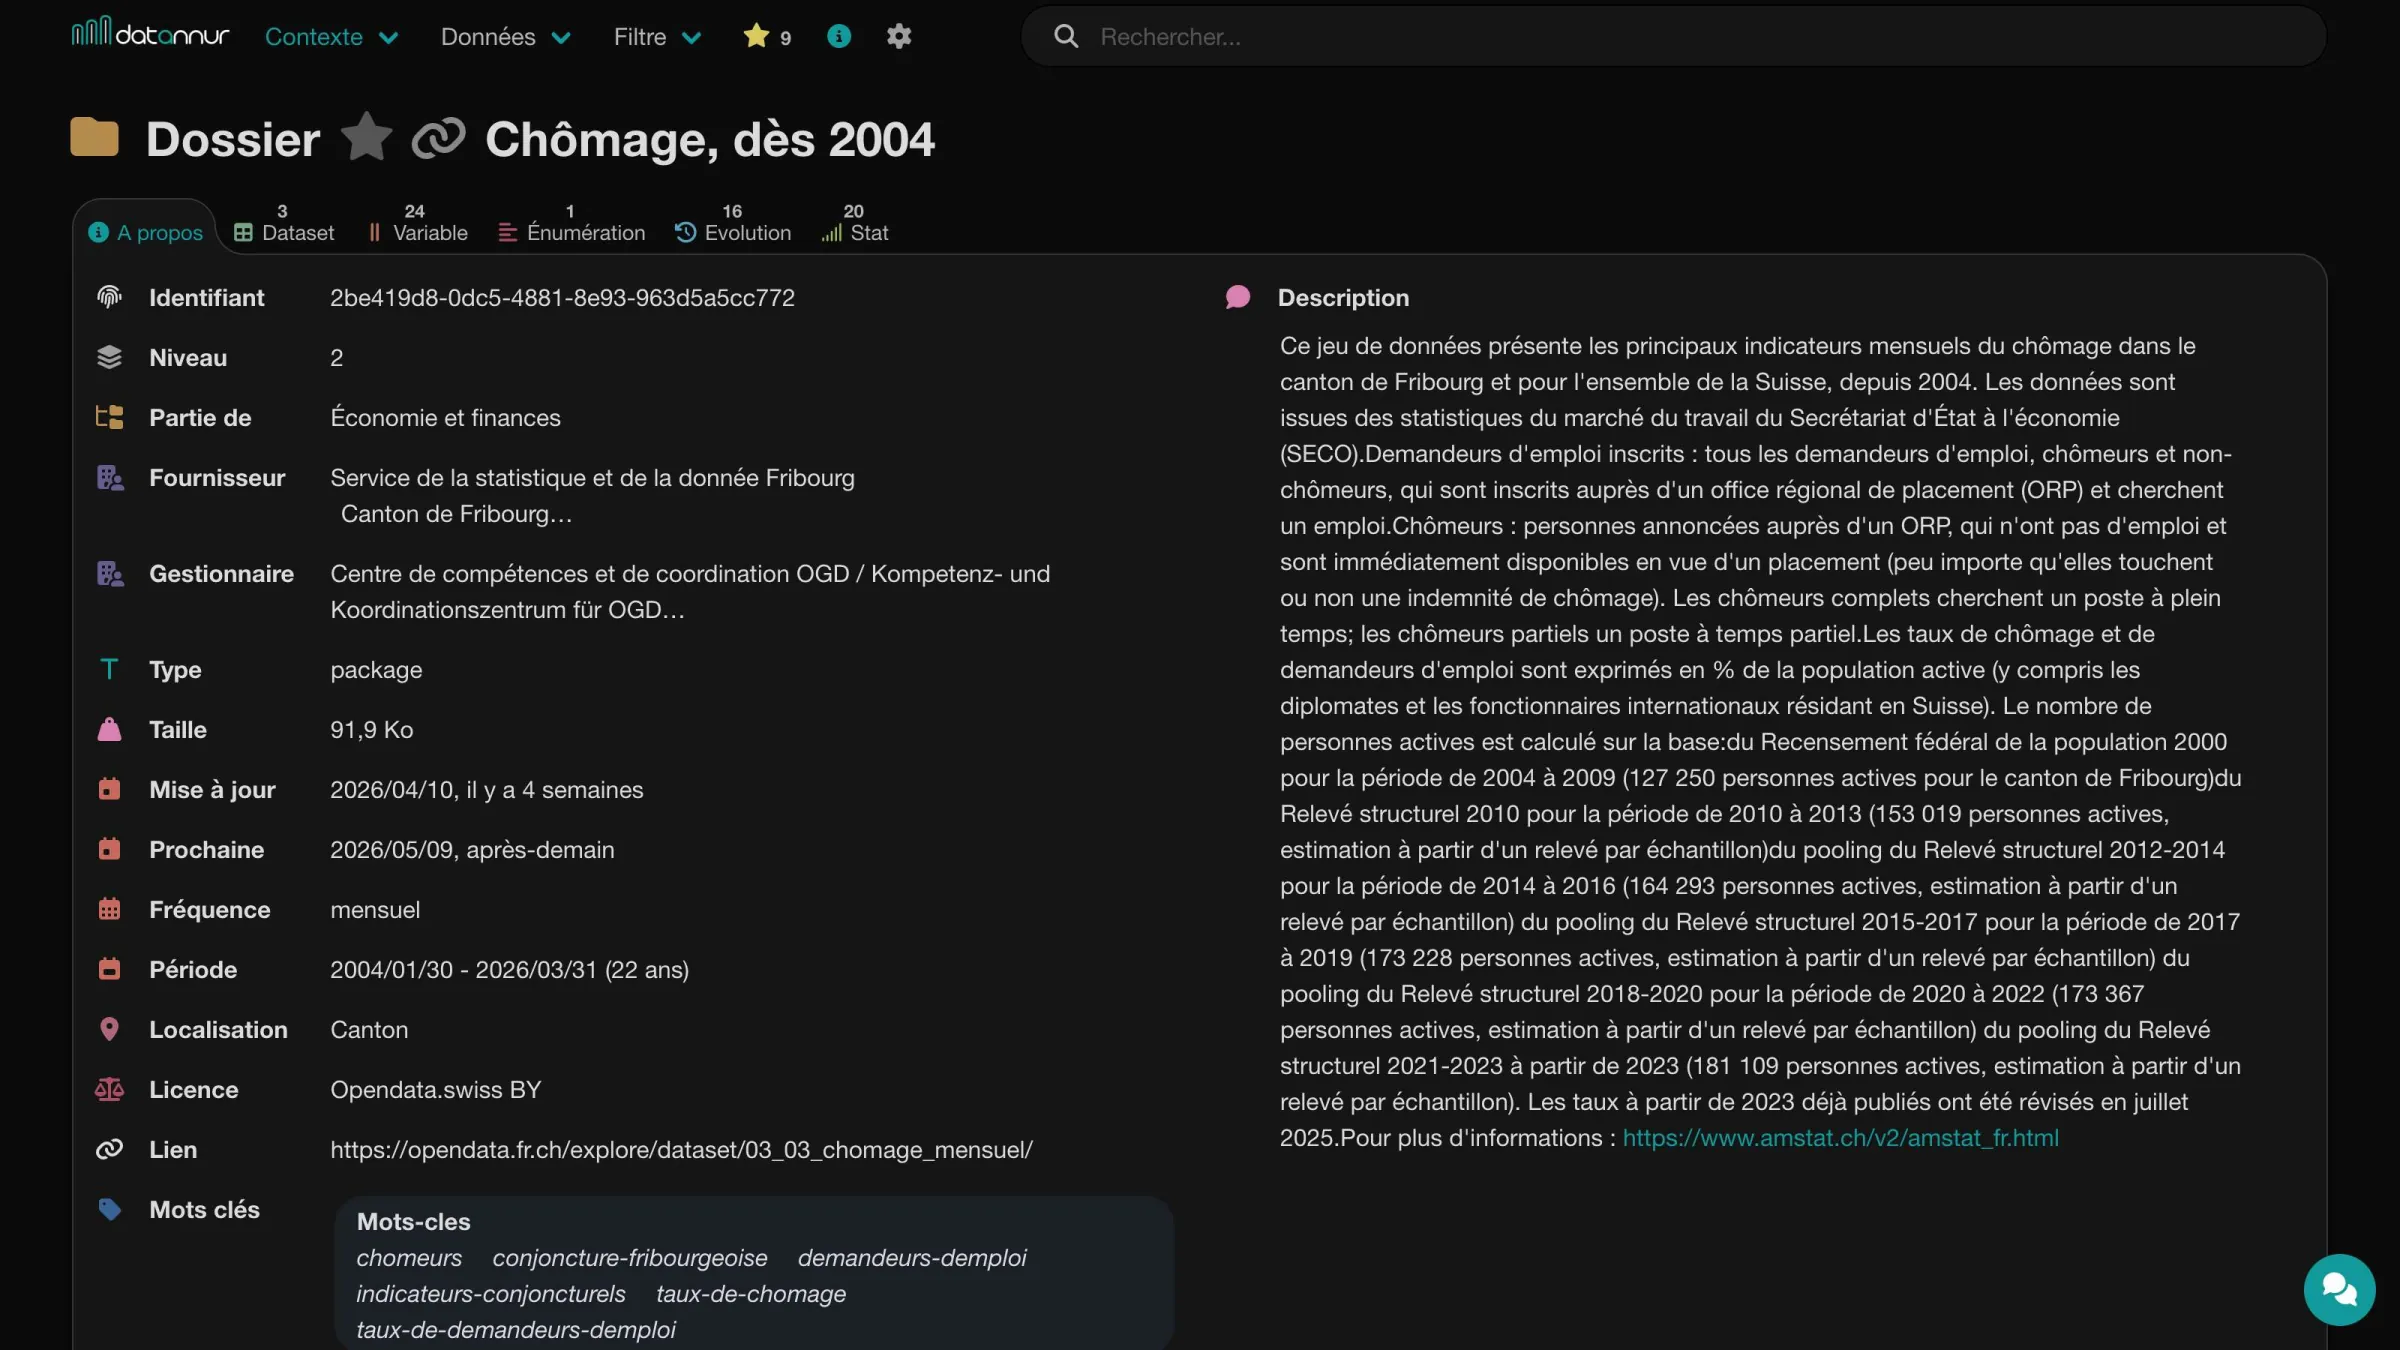 Folder – About tab
Doc
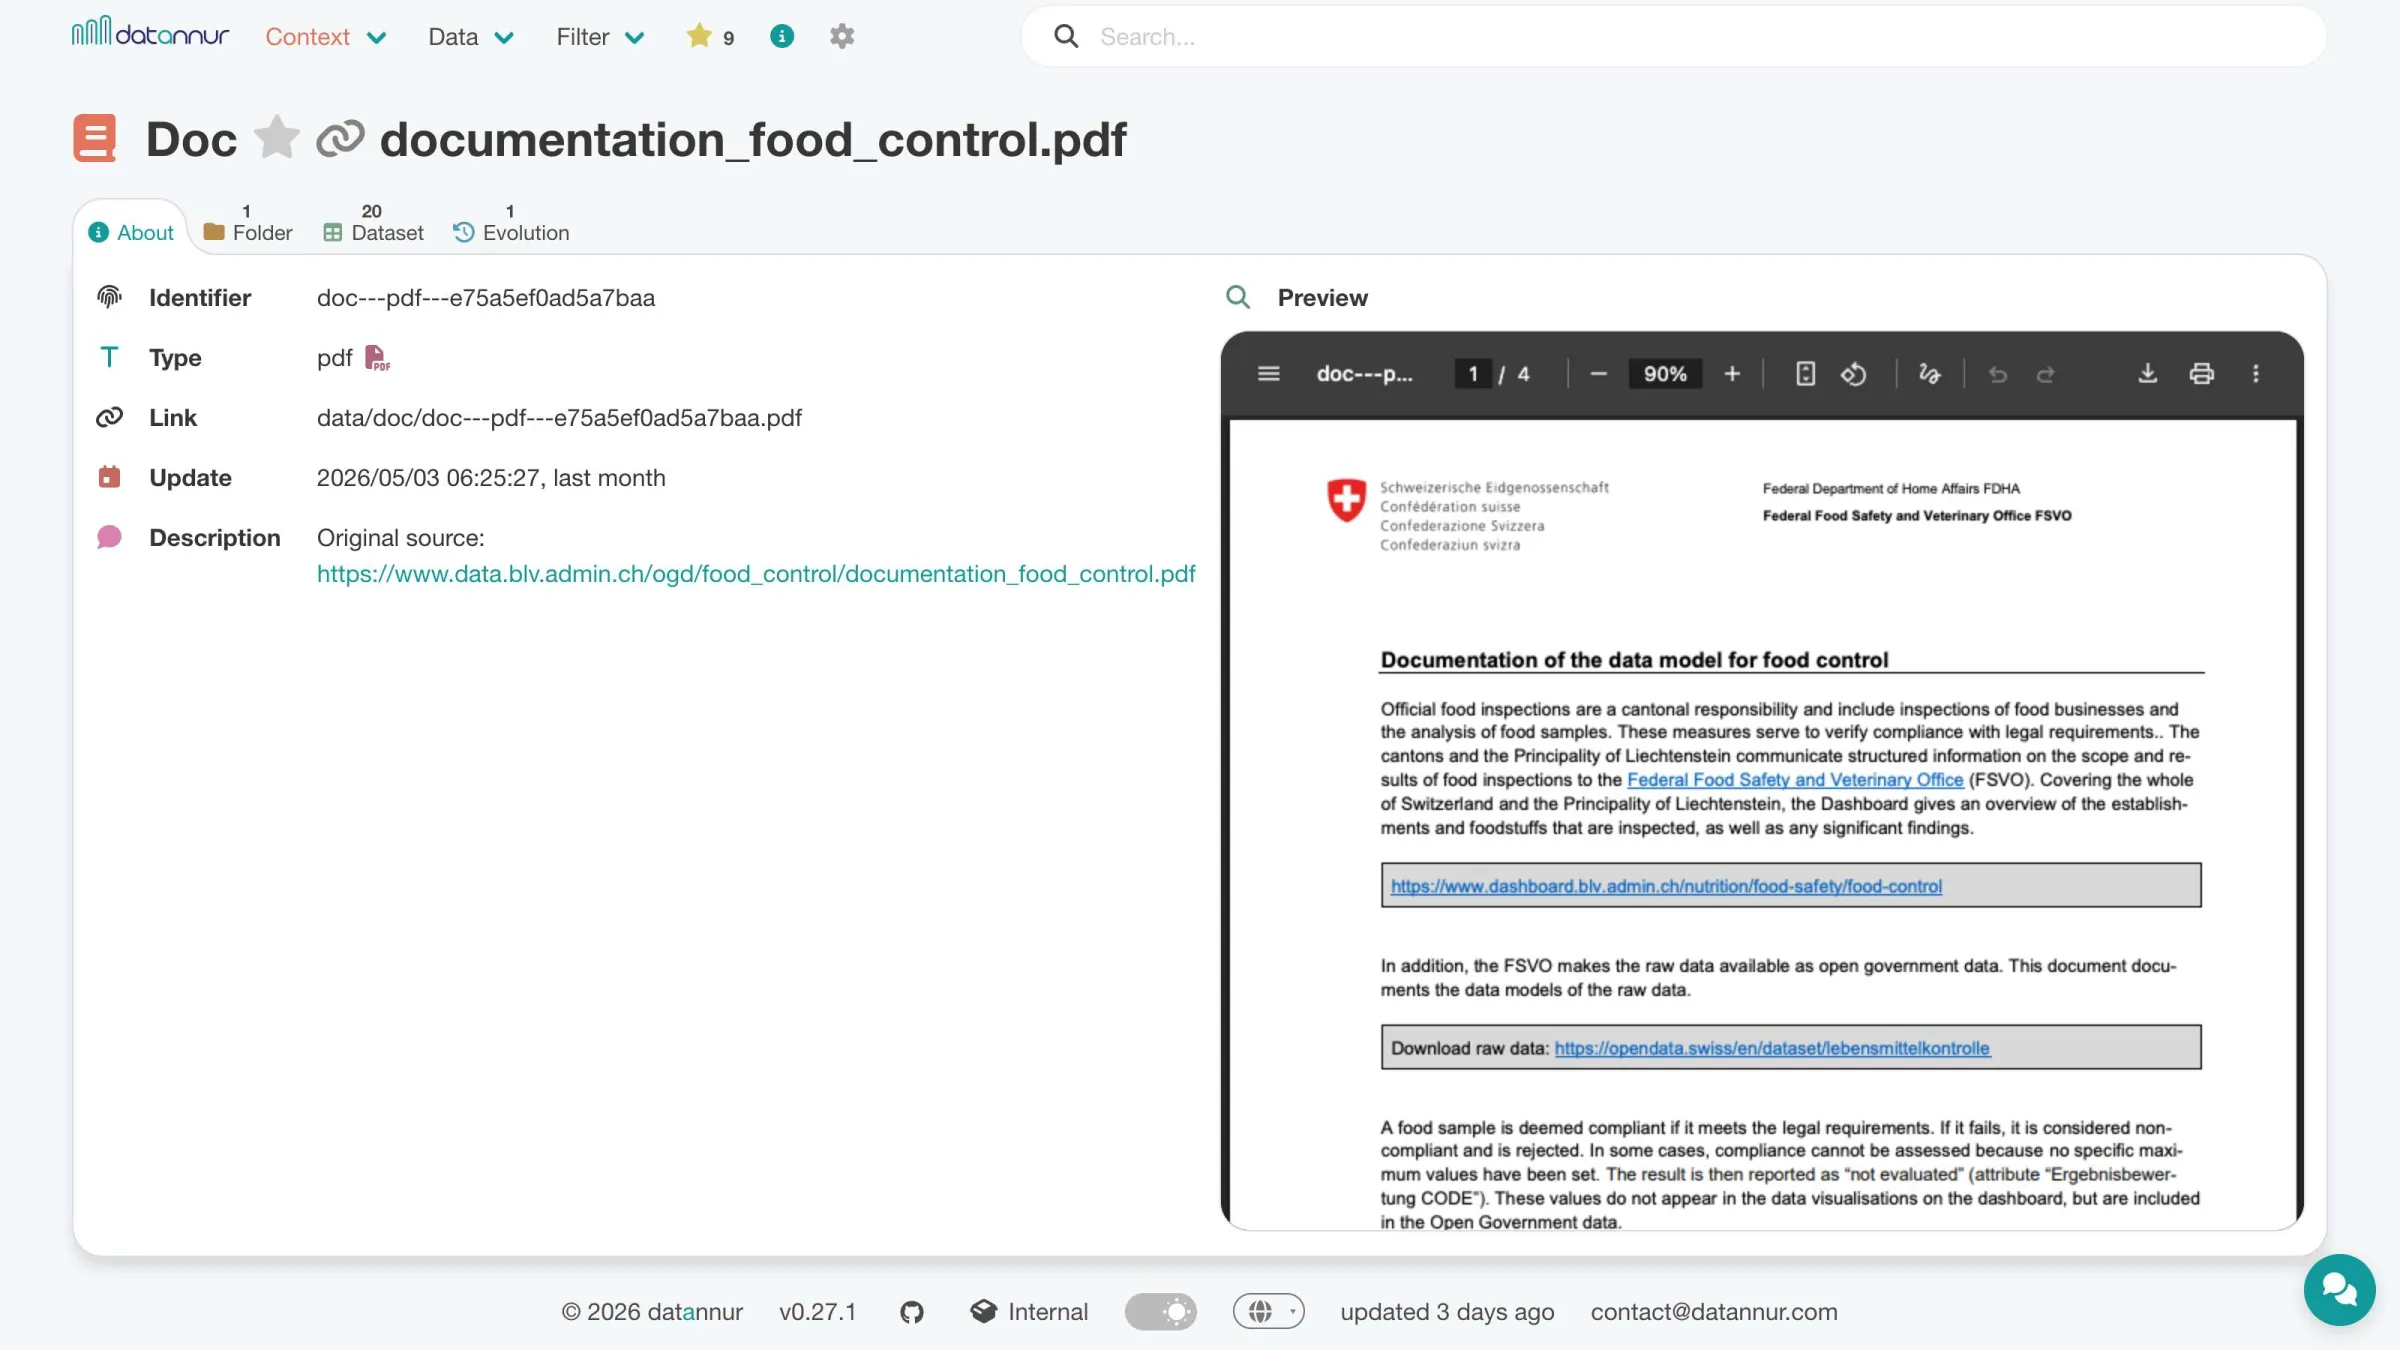
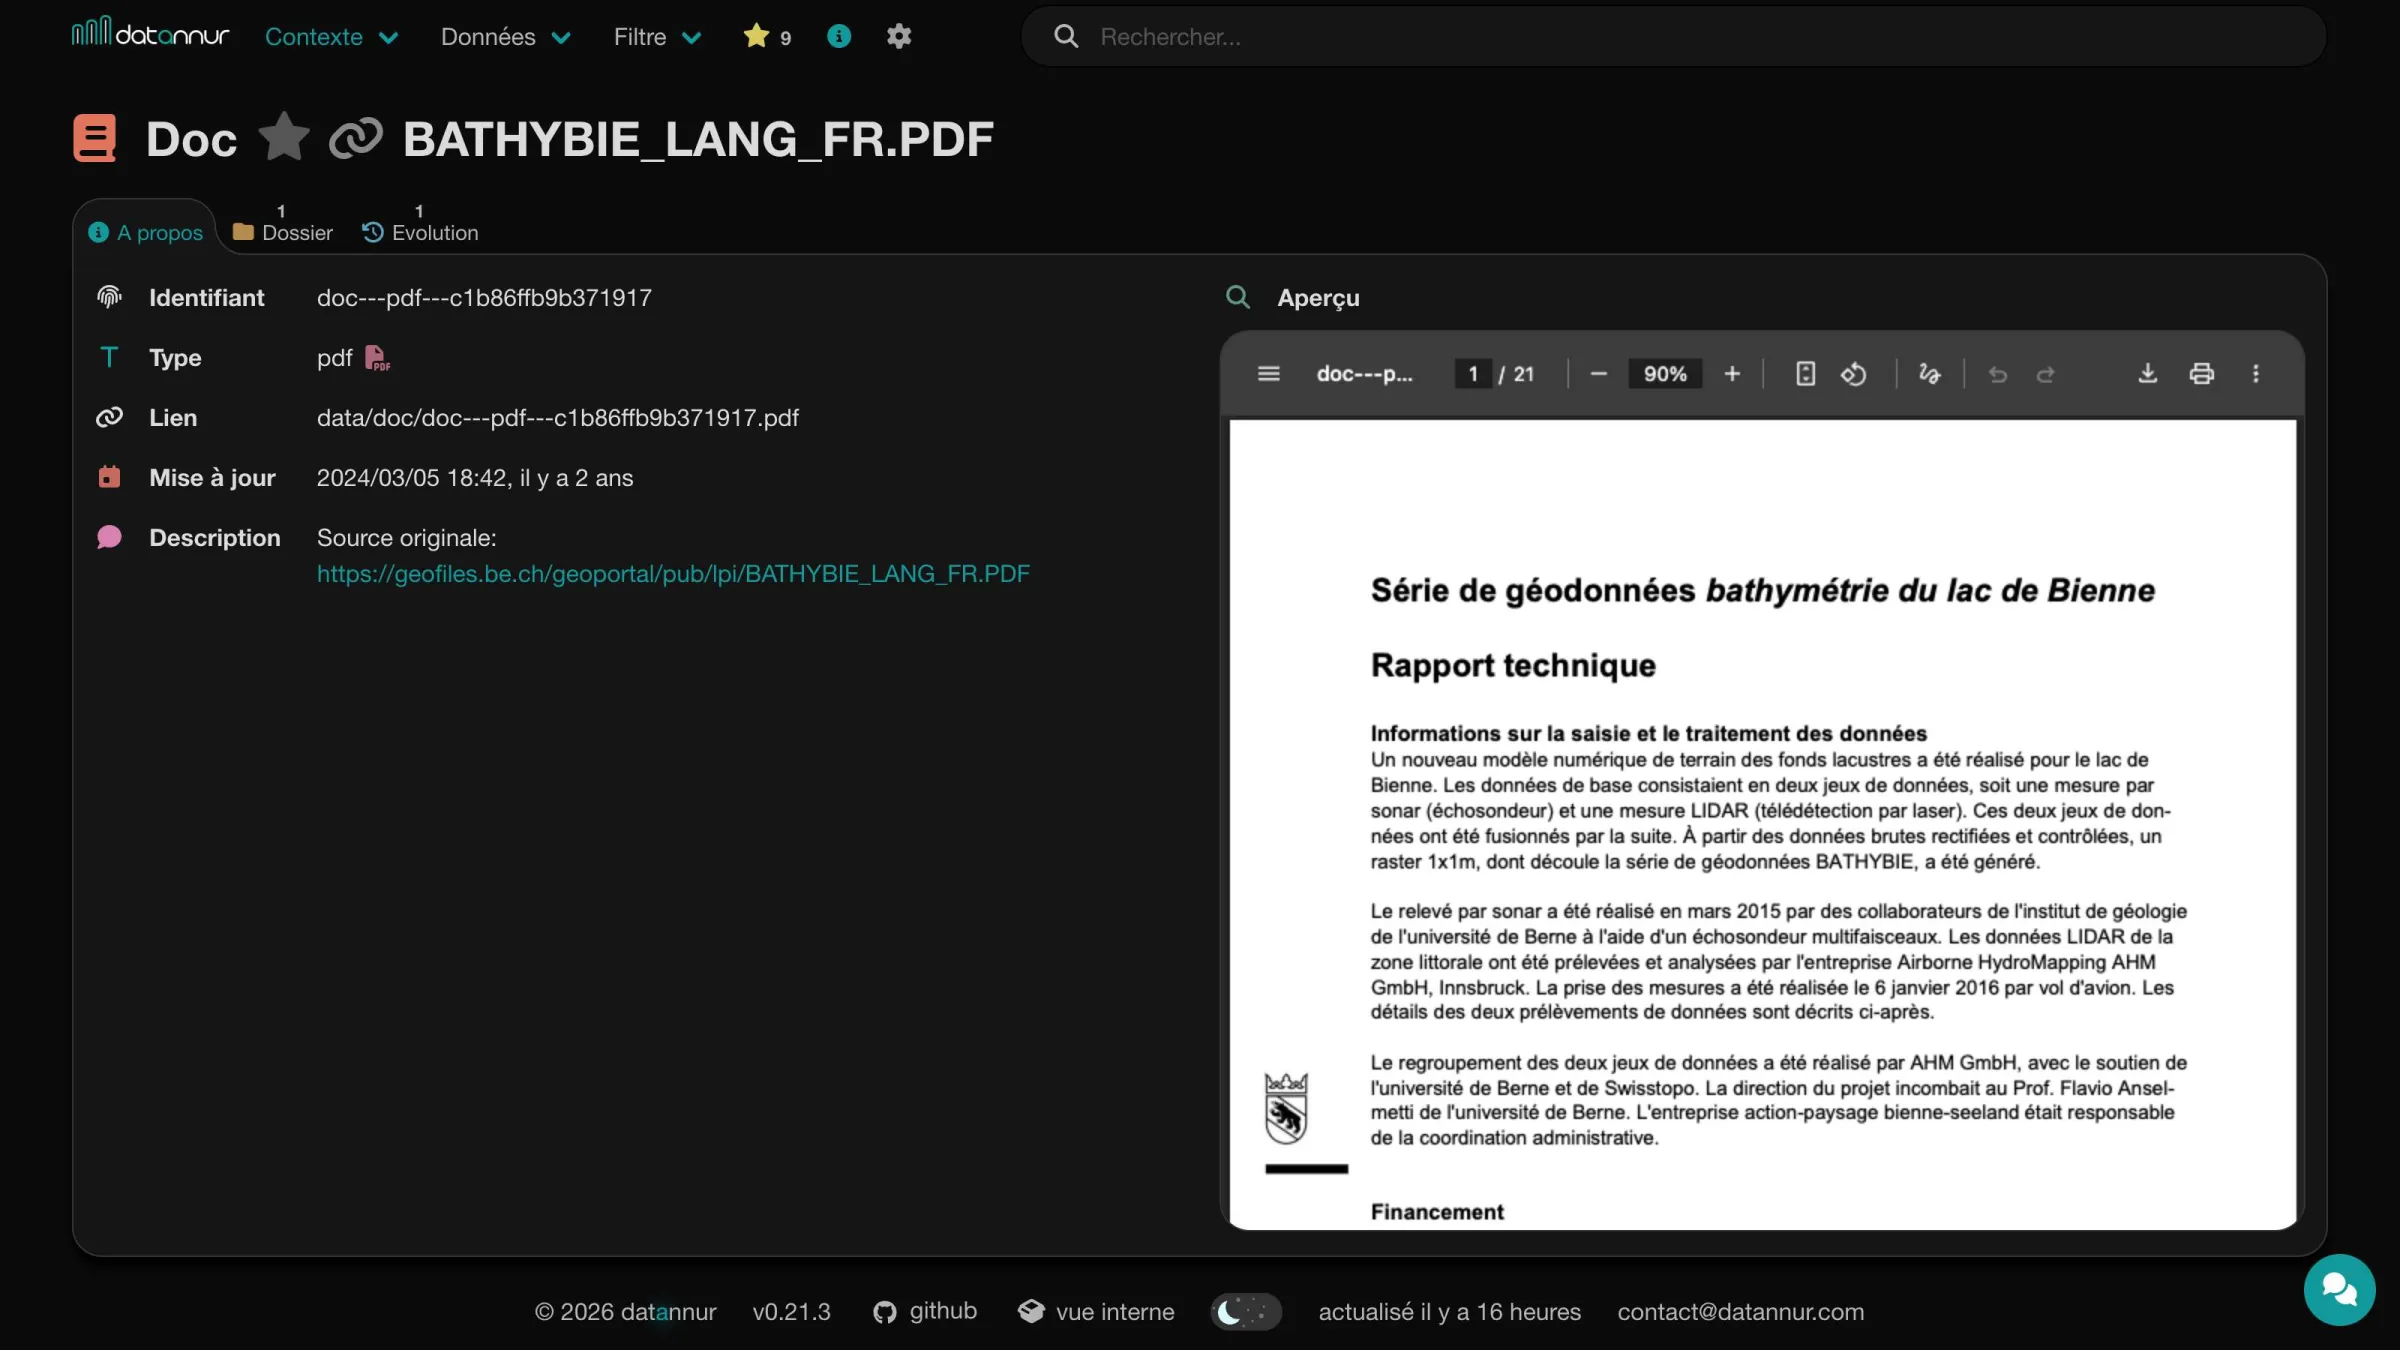
The catalog can link one or more existing documents to its main items, in Markdown or PDF format. This may include, for example, a README, a notice, a report, or business documentation already present within the organization. Accessible directly from the relevant item’s page, these documents provide context, explanations, and additional information.
Business glossary
datannur can also include a business glossary in the form of concepts. These concepts are used to precisely define certain notions used in the data and to remove ambiguity about the exact meaning of a variable.
Each concept has its own page, can be organized hierarchically, enriched with keywords or documents, and linked to the relevant variables. This semantic layer complements standard metadata by providing a more business-oriented level of explanation.
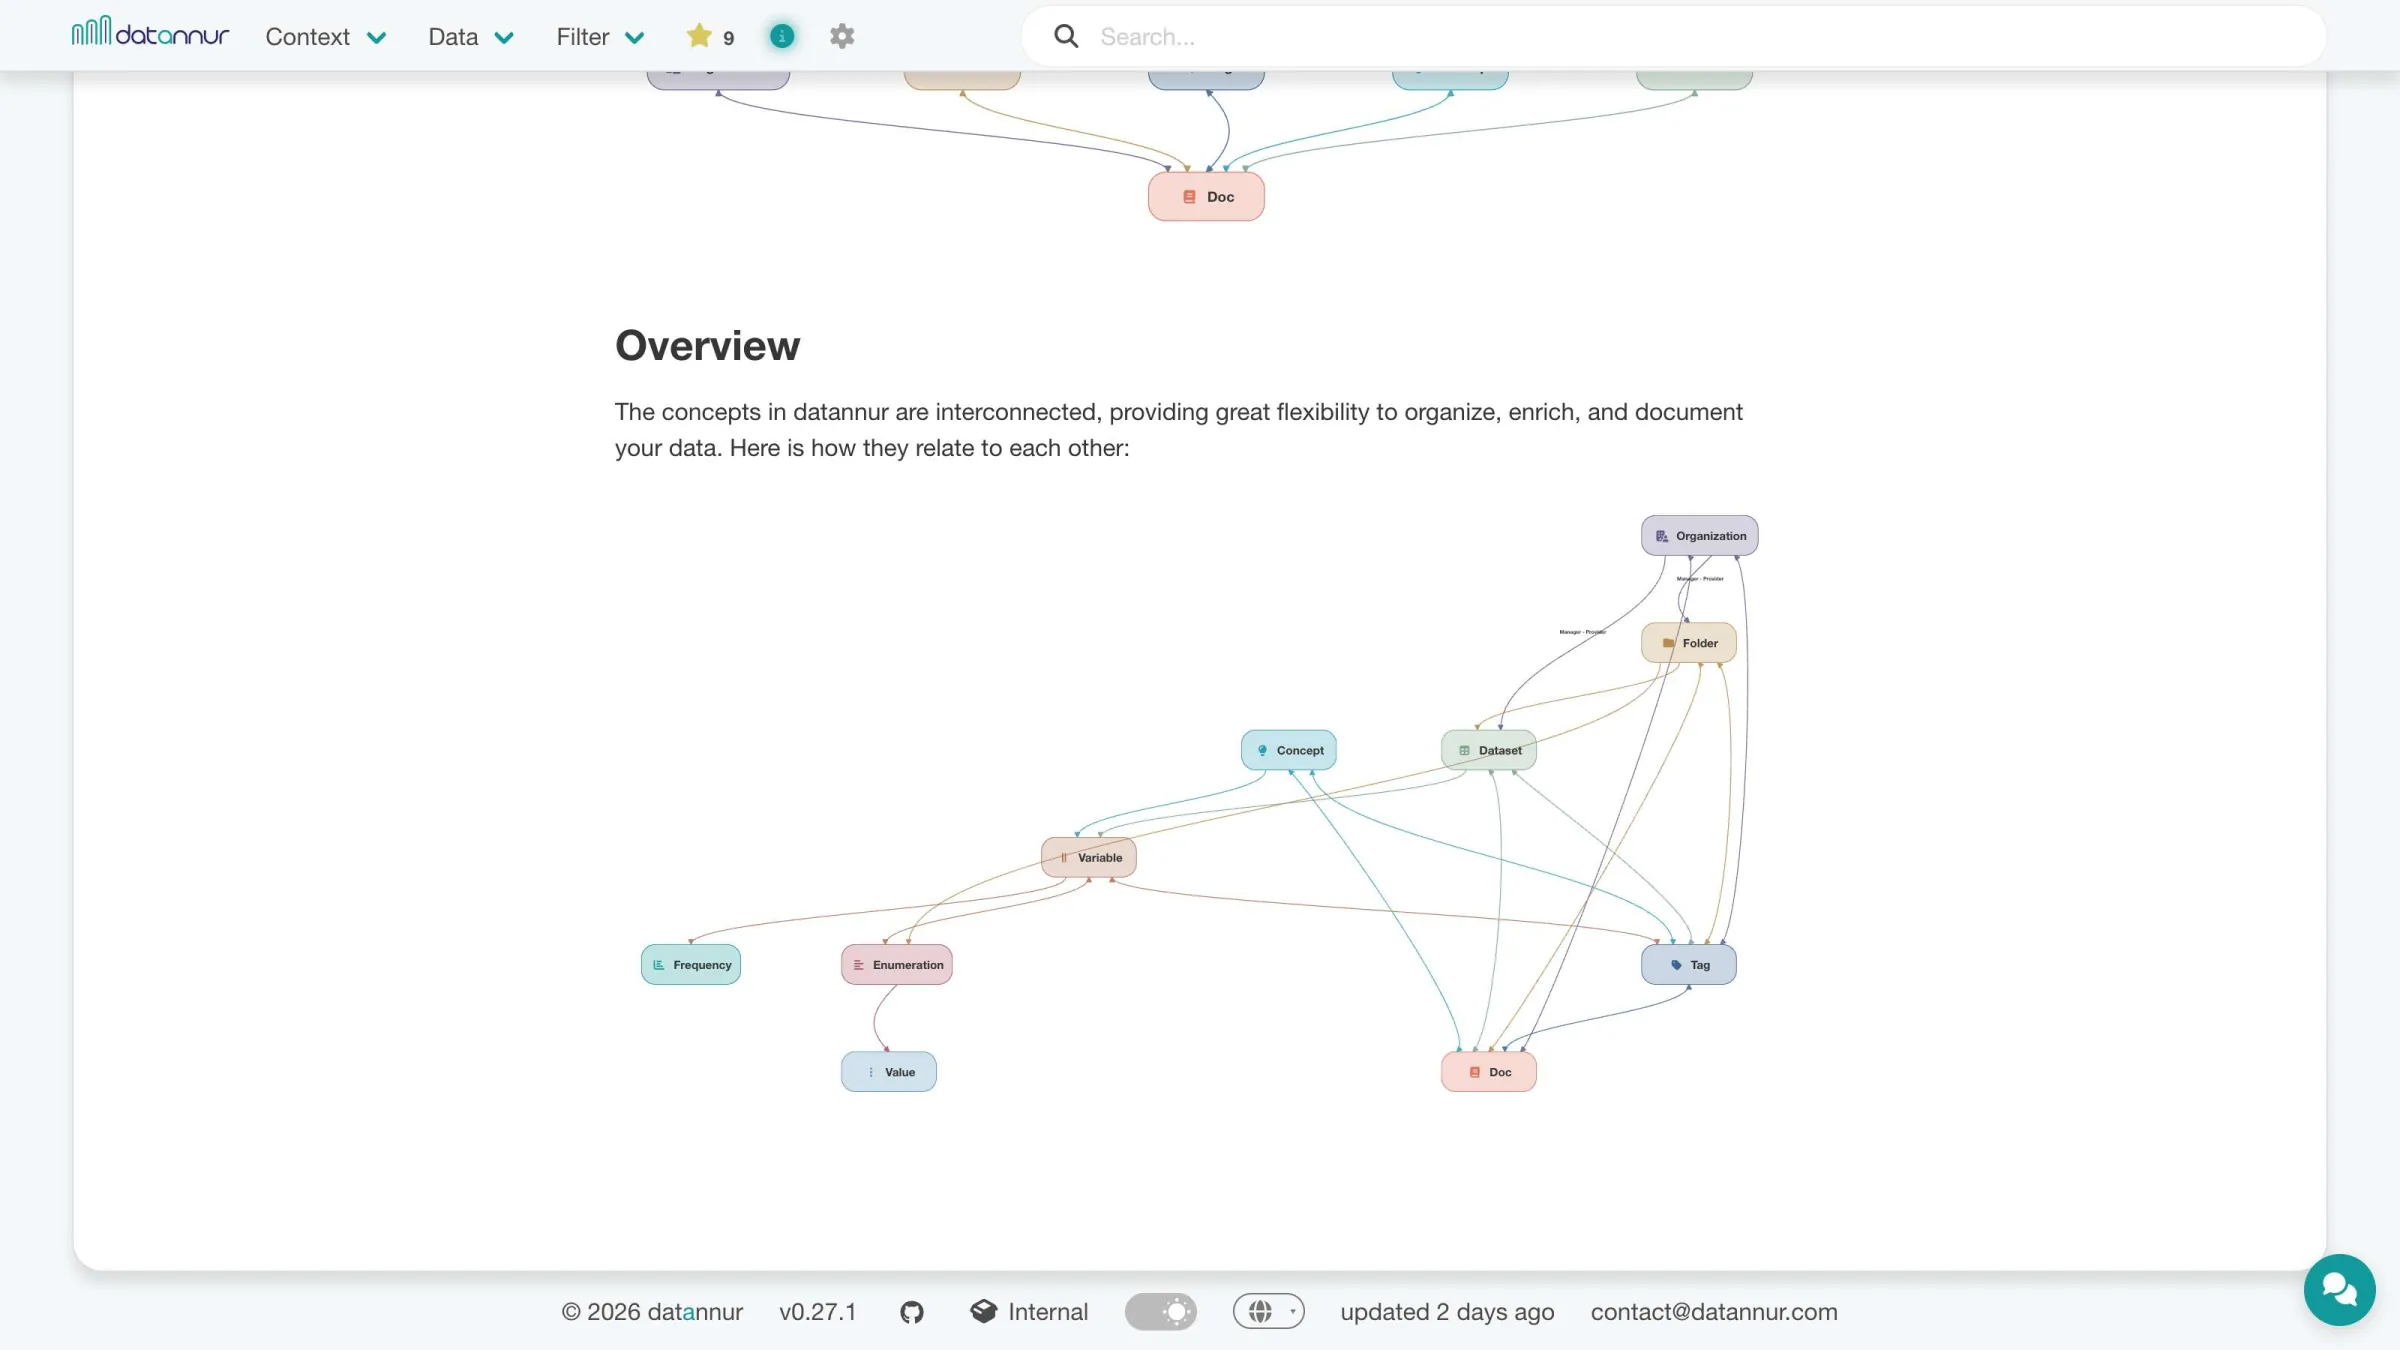
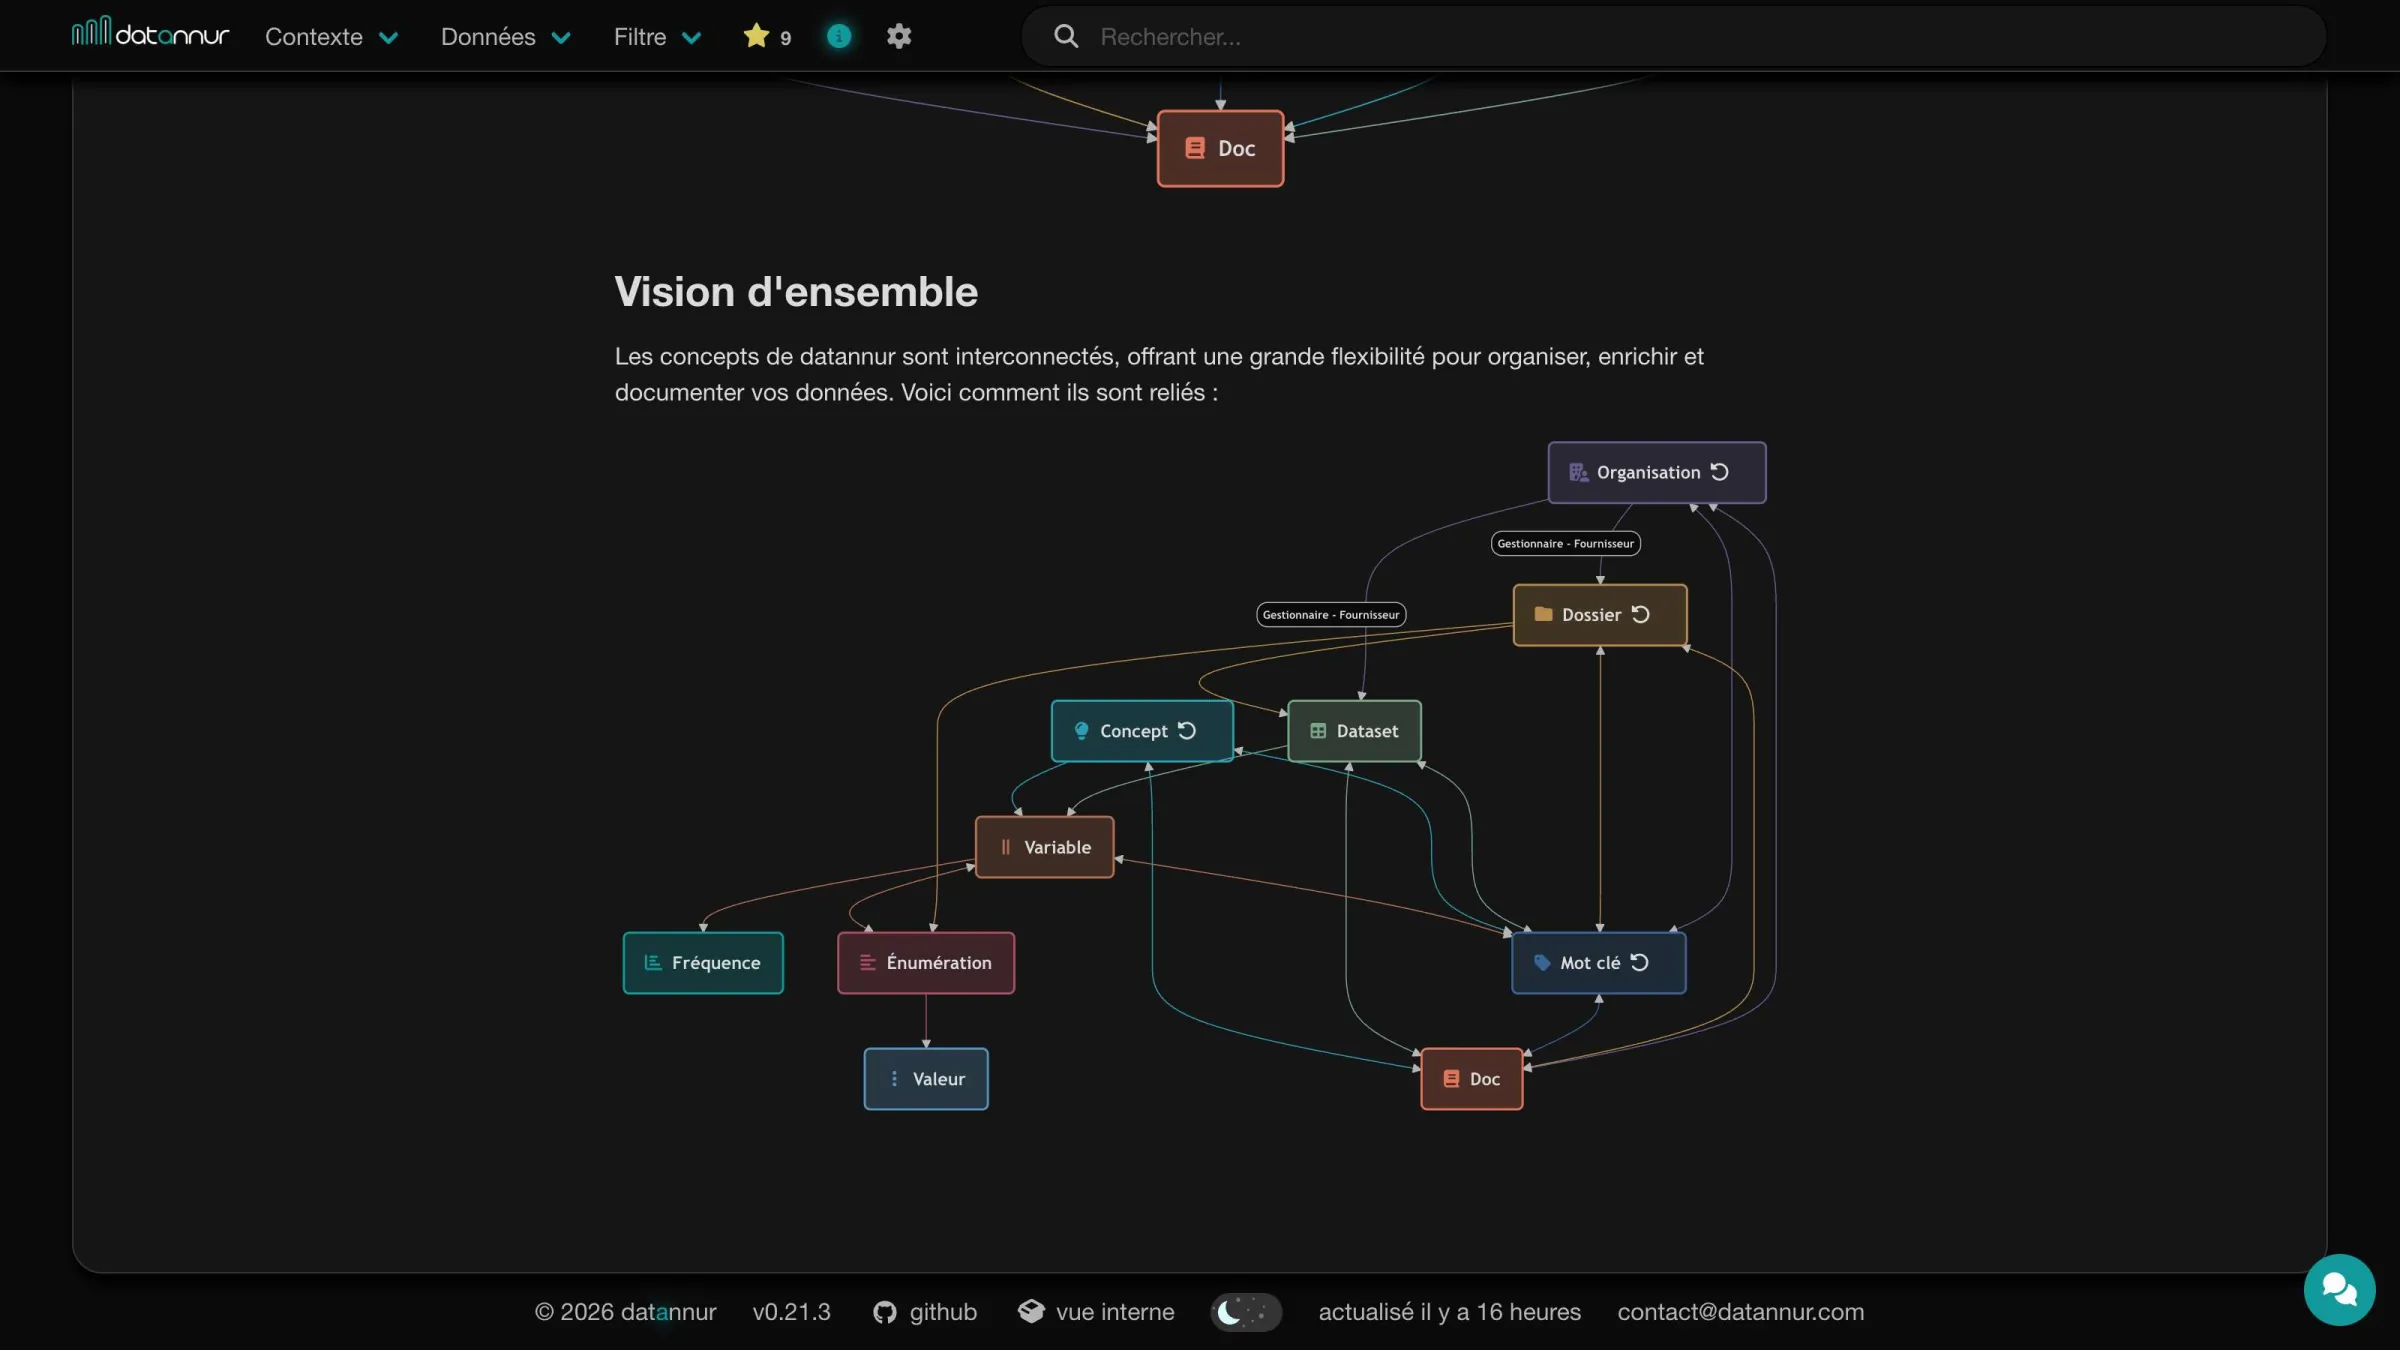
Dependencies (lineage)
For each variable, datannur displays its dependency links with other variables in the catalog. It distinguishes source variables, used as inputs, and derived variables, which depend on them.
These relationships make transformation chains within the catalog visible and also make it possible to infer dependencies between datasets. This way, you can quickly see which datasets another relies on, or which datasets it feeds.
Statistical summary
The “Stat” tab provides a visual summary of the information available in the catalog. Depending on the item type, it can display both aggregated summaries—for example, the number of variables per dataset or the keywords associated with a folder—as well as more detailed descriptive statistics at the variable level.
For variables, datannur can in particular present value frequencies as well as statistical indicators such as minimum, maximum, mean, or standard deviation. This information supports exploration, consistency checks, and a quick understanding of the data’s content.
Data preview
For compatible datasets, a dedicated tab displays a tabular preview of the content. This preview provides an initial reading of the data and relies on the built-in sorting and filtering functions to browse records more efficiently.
Similar enumerations
Harmonizing enumerations across multiple datasets can quickly become tedious. To simplify this work, datannur provides a tab that compares enumerations based on their similarity and helps identify duplicates, close variants, or partial overlaps.
This view helps identify label discrepancies, standardize values, and improve the overall consistency of the catalog.
Change history
The “Change history” tab makes it possible to track, over time, changes made to catalog items. It highlights additions, deletions, and modifications, with timestamps, to make the metadata history easier to read.
This view helps track changes, check consistency, and understand how a dataset, a variable, or another catalog item evolves.
Usage
Usage data is stored locally in the browser. The catalog therefore remains fully functional without an internet connection, while retaining the user’s favorites, searches, logs, and preferences.
These items can be exported and imported at any time, making it easier to maintain continuity of use from one workstation to another or over time.
Favorites
All catalog items can be added to favorites in one click. A dedicated page then makes it possible to find them in one place, with separate tabs depending on the item type.
Customization
A settings page allows you to adjust several aspects of the interface, such as dark mode, the displayed tree depth, or other visual preferences. It also allows you to reset locally stored usage data, such as favorites, searches, preferences, or logs.
A dedicated tab also groups usage logs—pages viewed, searches, favorites—along with a statistical summary to visualize the main usage patterns.
Download
Usage data stored in the browser can be exported or imported at any time as a compressed (ZIP) file.
Catalog tables can also be exported easily, either by copying to the clipboard or in CSV or Excel (XLSX) format.
Interoperability
datannur can expose the catalog’s metadata via a REST API and produce a DCAT export. These mechanisms make it possible to integrate the catalog with other tools, feed open data portals, or reuse metadata in existing processing pipelines.
For geospatial data, the spatial metadata (coordinate reference system, bounding box, resolution) is normalized and harvestable by spatial data infrastructures such as INSPIRE or GeoCAT.
Internal view
datannur includes an internal view that allows you to directly explore the structure of its own metadata. The catalog thus becomes readable from the inside: you can see how information is organized, linked, and stored.
This transparency helps you understand how the tool works, check internal structures, and take ownership of the catalog for more advanced use cases.